Download
1 / 6
60 likes | 100 Views
A simple, precise, accurate, rapid and reproducible reverse phase high performance liquid chromatographic procedure is developed for simultaneous determination of Ciprofloxacin Hydrochloride and Tinidazole in tablet<br>formulations. The mobile phase used was a combination of acetonitrile: water: triethylamine (30:67:3) v/v and the<br>pH was adjusted to 6.0±0.1 by addition of 50% ortho phosphoric acid. The detection of the tablet dosage form was<br>carried out at 296 nm and a flow rate employed was 1ml/min. Linearity was obtained in the concentration range of<br>2-16 µg/ml of Ciprofloxacin Hydrochloride and 5 -55 µg/ml of Tinidazole with a correlation coefficient of 0.9992<br>and 0.9996 respectively. The results of the analysis were validated statistically and recovery studies confirmed the<br>accuracy of the proposed method. The developed method has been successfully used for the simultaneous estimation<br>of both drugs in commercial formulation. <br>

E N D
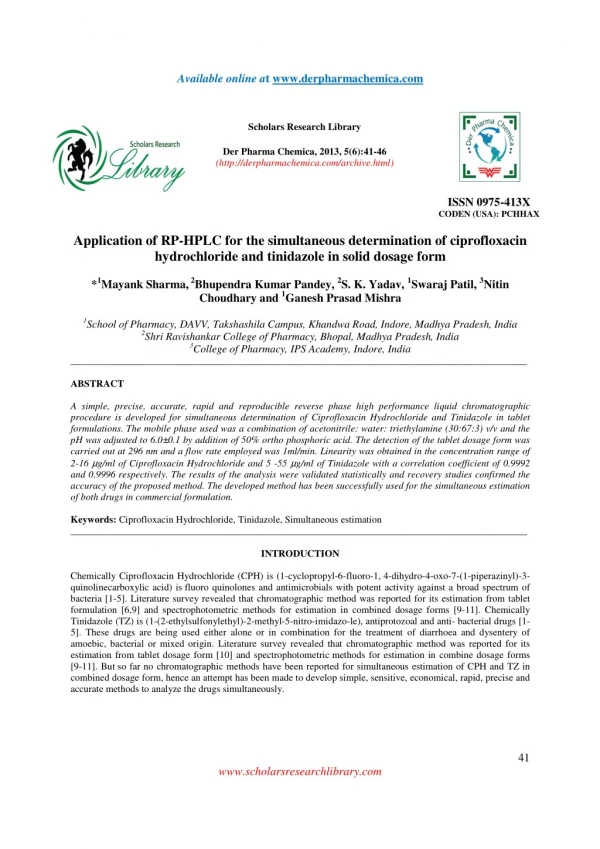
Available online at www.derpharmachemica.com Scholars Research Library Der Pharma Chemica, 2013, 5(6):41-46 (http://derpharmachemica.com/archive.html) ISSN 0975-413X CODEN (USA): PCHHAX Application of RP-HPLC for the simultaneous determination of ciprofloxacin hydrochloride and tinidazole in solid dosage form *1Mayank Sharma, 2Bhupendra Kumar Pandey, 2S. K. Yadav, 1Swaraj Patil, 3Nitin Choudhary and 1Ganesh Prasad Mishra 1School of Pharmacy, DAVV, Takshashila Campus, Khandwa Road, Indore, Madhya Pradesh, India 2Shri Ravishankar College of Pharmacy, Bhopal, Madhya Pradesh, India 3College of Pharmacy, IPS Academy, Indore, India _____________________________________________________________________________________________ ABSTRACT A simple, precise, accurate, rapid and reproducible reverse phase high performance liquid chromatographic procedure is developed for simultaneous determination of Ciprofloxacin Hydrochloride and Tinidazole in tablet formulations. The mobile phase used was a combination of acetonitrile: water: triethylamine (30:67:3) v/v and the pH was adjusted to 6.0±0.1 by addition of 50% ortho phosphoric acid. The detection of the tablet dosage form was carried out at 296 nm and a flow rate employed was 1ml/min. Linearity was obtained in the concentration range of 2-16 µg/ml of Ciprofloxacin Hydrochloride and 5 -55 µg/ml of Tinidazole with a correlation coefficient of 0.9992 and 0.9996 respectively. The results of the analysis were validated statistically and recovery studies confirmed the accuracy of the proposed method. The developed method has been successfully used for the simultaneous estimation of both drugs in commercial formulation. Keywords: Ciprofloxacin Hydrochloride, Tinidazole, Simultaneous estimation _____________________________________________________________________________________________ INTRODUCTION Chemically Ciprofloxacin Hydrochloride (CPH) is (1-cyclopropyl-6-fluoro-1, 4-dihydro-4-oxo-7-(1-piperazinyl)-3- quinolinecarboxylic acid) is fluoro quinolones and antimicrobials with potent activity against a broad spectrum of bacteria [1-5]. Literature survey revealed that chromatographic method was reported for its estimation from tablet formulation [6,9] and spectrophotometric methods for estimation in combined dosage forms [9-11]. Chemically Tinidazole (TZ) is (1-(2-ethylsulfonylethyl)-2-methyl-5-nitro-imidazo-le), antiprotozoal and anti- bacterial drugs [1- 5]. These drugs are being used either alone or in combination for the treatment of diarrhoea and dysentery of amoebic, bacterial or mixed origin. Literature survey revealed that chromatographic method was reported for its estimation from tablet dosage form [10] and spectrophotometric methods for estimation in combine dosage forms [9-11]. But so far no chromatographic methods have been reported for simultaneous estimation of CPH and TZ in combined dosage form, hence an attempt has been made to develop simple, sensitive, economical, rapid, precise and accurate methods to analyze the drugs simultaneously. 41 www.scholarsresearchlibrary.com
Mayank Sharma et al _____________________________________________________________________________ Der Pharma Chemica, 2013, 5 (6):41-46 MATERIALS AND METHODS Materials Ciprofloxacin (CPZ) and Tinidazole (TZ) were supplied as gift sample by Cipla Pharmaceutical, Pvt.Ltd, Sikkim (India).All the buffer materials and reagents used were of HPLC grade and purchased from Spectrochem, Mumbai, India. Nylon filter paper of 0.2µm (Ultipor) was purchased from Pall Life Science, Mumbai, India. Instrumentation Shimadzu HPLC (LC-10 AT VP) system; LC system used consist of pump (Model SHIMADZU; LC-10 AT VP) with universal loop injector (Rheodyne 7725 i) of injection capacity 20 µl. Detector consists of photodiode array detector SPD-10 AVP, SHIMADZU; the reverse phase column used was Luna C18 (5µM, 25cm×4.6mm i.d) phenomenex, USA, at ambient temperature. Preparation and selection of mobile phase The preliminary isocratic studies on a reverse phase C18 column with different mobile phase combination of acetonitrile and phosphate buffer pH 7.0±0.1 were studied for separation of both drugs. The optimal composition of mobile phase determined to be acetonitrile: water: triethylamine (30:67:3) v/v and the pH was pH was adjusted to 6.0±0.1 by addition of 50% ortho phosphoric acid and was filtered through 0.2 micron membrane filter. Preparation of standard and sample solutions CPZ and TZ (10 mg each) were weighed accurately and transferred to separate 100 ml volumetric flasks, both drugs were dissolved in the sufficient amount of mobile phase and final volume made upto 100 ml with mobile phase to get a standard stock solution of 100 µg/ml. Twenty capsules were weighed, with and without shell, their average weight was determined and the content was finely powdered and powder equivalent to weight of one capsule was transferred to a 100 ml volumetric flask and dissolved in 50 ml of mobile phase. The solution was shaken vigorously for 15 min and final volume was made upto 100 ml. The solution was filtered through whatman filter paper # 41. Preparation of calibration curves Solutions of both drugs having different concentrations were prepared by dilution of the standard solutions. These solutions (20 µl) were chromatographed and peak areas were measured, peak areas were then plotted against the respective concentrations for both CPZ and TZ. Analysis of Tablet dosage form Six replicates of the required dilutions were prepared from capsule stock solution and sonicated for 10 min. These solutions (20 µl) were injected for quantitative analysis. The amounts of CPZ and TZ per tablet were calculated by extrapolating the peak area from the calibration plot. Results of analysis are reported in Table 1. Precision was measured both intra-day and inter-day. In the intra-day study the concentration of both drugs were calculated three times on the same day at intervals of an hour. In the inter-day study the concentrations of both drugs were measured on three different days. Table 1: Studies of CPZ and TZ in marketed formulation Drug Label claim (mg/cap) (n=6) Amount found (mg) CPZ 300 300.356 TZ 600 601.453 S.D.: Standard deviation, COV: Coefficient of variance, S.E.: Standard error Recovery studies: To perform the accuracy of the developed method and to study the interference of formulation additives, analytical recovery experiments were carried out by standard addition method. The results of the analysis are reported in Table 2. % of drug content 101.30 99.30 S.D. 0.586 0.694 % COV 0.583 0.693 S.E. 0.239 0.283 42 www.scholarsresearchlibrary.com
Mayank Sharma et al _____________________________________________________________________________ Der Pharma Chemica, 2013, 5 (6):41-46 Table 2: Results from the recovery study Amount taken (µg/ml) Amount added at (µg/ml) CPZ TZ 100 100 80% 100 100 100 100 100 100 100% 100 100 100 100 100 100 120% 100 100 100 100 % Recovery CPZ 98.30 99.12 98.23 99.96 99.93 99.97 100.01 99.99 100.10 Replicate % CPZ 80 80 80 100 100 100 120 120 120 TZ 80 80 80 100 100 100 120 120 120 TZ 98.47 98.83 98.89 100.32 100.36 100.21 101.01 101.11 101.17 1 2 3 1 2 3 1 2 3 Validation of the method Validation of the optimized HPLC method was done with respect to following parameters as per ICH norms [12- 14]. Linearity and range A stock solution of the drug (1mg ml-1) was prepared in water. From this stock solution seven concentrations of the drug were prepared in water within the concentration range of 5-100 µg ml-1. The solutions were injected in hexaplicate into the HPLC column, keeping all the conditions constant. The results of the analysis are reported in Table 3 and 4. Table 3: Results of Linearity Calibration Curve for CPZ Conc(µ µ µ µg/ml) 50 100 150 1 11050.10 11260.80 11990.12 2 10510.13 11971.09 12880.19 3 10826.08 11460.10 12766.18 Mean 10793.16 11560.16 12539.17 SD 221.5071 299.1425 395.4719 RSD 0.2052 0.2587 0.3154 SD.: Standard deviation, SD: Standard error, RSE:Relative Standard error Table 4: Results of Linearity Calibration Curve for TZ Conc (µ µ µ µg/ml) 100 200 1 7712.25 12814.84 21008.24 2 7780.02 13927.99 21217.68 3 6992.95 13547.85 21457.27 Mean 7486.482 13422.21 21226.94 SD 356.2108 462.0074 183.4538 RSD 0.4634 0.3442 0.0864 SD.: Standard deviation, SD: Standard error, RSE:Relative Standard error Table 5: Intra-day precision of HPLC study Intraday precision Hour CPZ After1 15471.18 After2 15782.99 After3 15472.51 After4 14572.15 After5 16985.89 Afte6 15724.39 Mean 15636.47 SD 710.861 RSD 0.4546 SD.: Standard deviation, SD: Standard error, RSE:Relative Standard error 200 250 300 13160.05 13165.98 13178.10 13168.04 7.51193 0.0570 13952.56 14958.53 14954.80 14614.18 473.3581 0.3239 15780.17 15772.26 15786.46 15779.63 5.809687 0.0368 300 400 500 600 27154.22 27066.77 26854.15 27024.75 126.0057 0.04662 34987.85 34791.80 33987.99 34586.49 432.5997 0.1250 47354.01 47346.51 47865.25 47521.3 242.7881 0.05109 TZ 47542.21 47214.25 46582.99 48521.21 47542.25 46582.15 47331.27 681.6852 0.1440 43 www.scholarsresearchlibrary.com
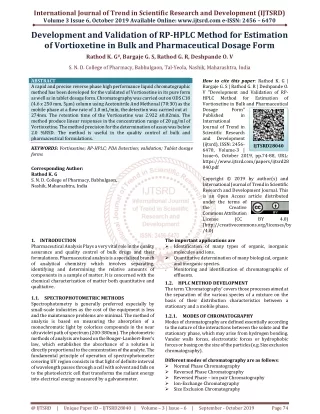
Mayank Sharma et al _____________________________________________________________________________ Der Pharma Chemica, 2013, 5 (6):41-46 Precision Precision of the method [15, 16] was verified by repeatability and intermediate precision studies. Repeatability studies were performed by analyses of three different concentration of (30, 50, 80 µg ml-1) drug in hexaplicate on the same day. Intermediate precision of the method was checked by repeating the studies on same day at an interval of one hour (intraday precision) for three hours and on three different days (interday precision). The results of the analysis are reported in Table 5 and 6. Table 6: Inter day precision of HPLC study Inter day precision Day CPZ First day 15472.25 Second day 14752.15 Third day 14241.54 Mean 14804.89 SD 504.928 RSD 0.3410 SD.: Standard deviation, SD: Standard error, RSE:Relative Standard error Accuracy Accuracy of the method was tested by fortifying a mixture of decomposed reaction solutions with three concentration of the drug and determining the percentage of recovery of added drug. Specificity and selectivity The specificity of the method towards the drug was established through study of resolution factor of the drug peak from the nearest resolving peak. Whereas selectivity was established through determination of purity for each degradation product peak using PDA detector. The results of the analysis are reported in Table 7. Table 7: system suitability study Property(n=5) tR Tf k/ N Rs tR : Retention time, Tf : Tailing factor, k/ : Capacity factor, N : Number of theoretical plates, Rs : Resolution factor RESULTS The HPLC method was found to be simple, accurate, economic and rapid for routine simultaneous estimation of CPZ and TZ in combined tablet dosage form at 295 nm. The regression: 0.9992 and 0.9996, intercept: 47245 and 228214 and slope: 23525 and 27245 were found to be for CPZ and TZ respectively. Recovery was in the range of 100.42–102.39% and shows the high precision (Table 5, 6) of the developed method. DISCUSSION Amongst the various mobile phases used, acetonitrile: water: tri ethylamine (30:67:3) v/v and the pH was adjusted to 6.0±0.1 by addition of 50% ortho phosphoric acid was found to be robust at 1ml/min flow rate. Mobile phase and flow rate selection was based on peak parameters such as height, tailing, theoretical plates, capacity factor, run time, resolutions. A typical chromatogram of CPZ and TZ is shown in Fig.1, 2. The optimum wavelength for detection was 295 nm at which detector response was obtained best. The average retention time for CPZ and TZ was found to be 8.43 ± 0.05 min. and 11.82± 0.05 min respectively. They are used to verify reproducibility of the chromatographic system. To ascertain its effectiveness, system suitability tests were carried out and its results are shown in Table 7. TZ 48751.22 47841.52 47516.12 48030.63 522.7049 0.1088 CPZ 8.34 0.93 0.43 9708 2.15 TZ 11.42 1.07 .97 6016 5.51 44 www.scholarsresearchlibrary.com
Mayank Sharma et al _____________________________________________________________________________ Der Pharma Chemica, 2013, 5 (6):41-46 Hence it can be concluded that the developed RP-HPLC method is an accurate, precise and robust method and can be employed successfully for the estimation of CPZ and TZ in bulk and formulation. Fig 1: Typical chromatogram of CPZ and TZ in Standard solution Fig 2: Typical chromatogram of CPZ and TZ in Tablet dosage form Acknowledgement The authors express their gratitude to the Cipla Pharmaceutical, Pvt.Ltd, Sikkim (India) for providing gift samples of pure drug. REFERENCES [1]Indian Pharmacopoeia, The Controller of Publication: New Delhi, Vol. 1, 1996: 764. [2]British Pharmacopoeia, The Stationary Office: London, 1998:1296. [3]United State Pharmacopoeia, United State Pharmacopoieal Convention, 2003: 1263. [4]MS. Garcia, M.I. Albero, Indian J Pharm Biopharm., 2001: 61: 87. [5] R. Sharma, G. Pathodiya, G.P. Mishra, J. Sainy, Journal of Pharmacy Research, 2011, 4(3), 859-861. [6]R. Sharma, G. Pathodiya, G.P. Mishra. S. J. Pharm. Sci, 2010, 3(2), 37-42. [7]M.S. Bhatia, S.G. Kaskhedikar, S.C, Chaturvedi, Indian J. Pharm. Sci, 1999, 8, 311. 45 www.scholarsresearchlibrary.com
Mayank Sharma et al _____________________________________________________________________________ Der Pharma Chemica, 2013, 5 (6):41-46 [8]S.A. Patel, N.M. Patel, M.M. Patel, Ind. J. Pharm.sci, 2006, 68(5), 665-667. [9]Current Index of Medical Specialties, Medimedia Health Private Ltd.Bangalore, 2006, 394. [10]H.; Salomies, J.P. Salo, Chromagraphia., 2005, 36, 79. [11]P.D. Panzade, K.R. Mahadik, Indian Drugs., 2000, 38(7), 368-372. [12]A.G. Davidson, A.H. Beckett, J.B. Stenlake, Practical Pharmaceutical Chemistry, CBS Publishers & Distributor, 4th ed., New Delhi, 2001., 2: p. 286-288. [13]R. Sharma, G.P. Mishra, S.C. Chaturvedi, E-Journal of Chemistry, 2010, 7(3), 947-952. [14]International Conference on Harmonization (ICH), Q2A: Text on Validation of Analytical Procedures: Definitions and Terminology,US FDA Federal Register, 1995, 60. [15]J. Bagyalakshmi, S.M. Philip, T.K. Ravi, Der Pharma Chemica, 2011, 3 (4), 140-145. [16]J.R. Jain, D.R. Shah, S.A. Shah, R.S. Chauhan, Der Pharma Chemica, 2011, 3 (4), 245-252 46 www.scholarsresearchlibrary.com