Download
1 / 14
150 likes | 182 Views
Here is the definitive guide on types of error in statistics. Watch this PPT till the end to find out the everything on the types of error in statistics.

E N D
STAT ANALYTICA A Definitive Guide on Types of Error in Statistics www.statanalytica.com
PRESENTATION OUTLINE MAIN TOPICS Overview What is the error in statistics? Types of error in statistics Type I error Type II error What is the standard error in statistics? The data affects two kinds of error Sampling error Non-sampling error What is the margin of error in statistics? Steps on Calculate Margin of Error Sample problem Conclusion
OVERVIEW A DEFINITIVE GUIDE ON TYPES OF ERROR IN STATISTICS Most of the students are not aware of the types of error in statistics. This guide will help you to know everything about the types of error in statistics. Let’s explore the guide:-As ‘statistics’ relates to the mathematical term, individuals start analyzing it as a problematic terminology, but it is the most exciting and straightforward form of mathematics.As the word ‘statistics’ refers that it consists of quantified statistic figures. That we use to represent and summarize the given data of an experiment or the real-time studies. Stat Analytica
WHAT IS THE ERROR IN STATISTICS? Statistics is a methodology of gathering, analyzing, reviewing, and drawing the conclusion of the particular information. The statistical error is the difference between the obtained value of the collected data and the actual value of the collected data. The higher the error value, the lesser will be the representative data of the community. In simple words, a statistics error is a difference between a measured value and the actual value of the collected data. If the error value is more significant, then the data will be considered as the less reliable. Therefore, one has to keep in mind that the data must have minimal error value. So that the data can be considered to be more reliable.
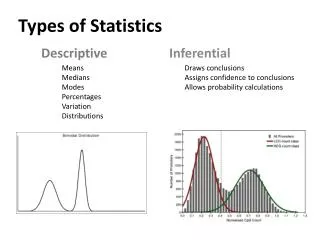
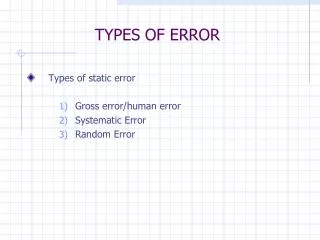
TYPES OF ERROR IN STATISTICS There are two types of error in statistics that is the type I & type II. In a statistical test, the Type I error is the elimination of the true null theories. In contrast, the type II error is the non-elimination of the false null hypothesis. Plenty of the statistical method rotates around the reduction of one or both kind of errors, although the complete rejection of either of them is impossible. But by choosing the low threshold value and changing the alpha level, the features of the hypothesis test could be maximized. The information on type I error & type II error is used for bio-metrics, medical science, and computer science.
TYPE I ERROR The initial type of error is the elimination of a valid null hypothesis, which is considered as the outcome of a test procedure. This type of error sometimes also called an error of the initial type/kind. A null hypothesis is set before the beginning of an analysis. But for some situations, the null hypothesis is considered as not being present in the ‘cause and effect’ relationship of the items that are being tested. This situation is donated as ‘n=0’ if you are conducting the test, and the outcome seems to signify that applied stimuli may cause a response, then the null hypothesis will be rejected. Stat Analytica
TYPE II ERROR A type II error implies the non-elimination of a wrong null hypothesis. We use this kind of error for the text of hypothesis testing. In the statistical data analysis, type I errors are the elimination of the true null hypothesis. On the other hand, type II error is a kind of error that happens when someone is not able to eliminate a null hypothesis, which is wrong. In simple words, type II error generates a false positive. The error eliminates the other hypothesis, even though that does not happen due to chance. A type II error proves an idea that has been eliminated, demanding the two observances could be identical, even though both of them are dissimilar. Besides, a type II errors do not eliminate the null hypothesis. Even though the other hypothesis has the true nature, or wrre can say that a false value is treated as true. A type II error is well-known as a ‘beta error’. Stat Analytica
WHAT IS THE STANDARD ERROR IN STATISTICS? ‘Standard error’ refers to the standard deviation of several statistics samples, like mean and median. For instance, the term “standard error in statistics” would refer to as the standard deviation of the given distributing data that is calculated from a population. The smaller the value of the standard error, the larger representative the overall data. The relation between standard deviation and the standard error is that for a provided data, the standard error is equal to the standard deviation (SD) upon the square root of the offered data size.Standard error = standard deviation √ Given data The standard error is inversely proportional to the given model size, which means the higher the model size, the lesser the value of standard error since the statistic will tend to the actual value.Standard error ∝ 1/sample sizeThe standard error is taken as a portion of explanatory statistics. The standard error shows the standard deviation (SD) of an average value into a data set. It treats as a calculation of the random variables as well as to the extent. The smaller the extent, the higher the accuracy of the dataset. Stat Analytica
SAMPLING ERROR NON-SAMPLING ERROR Sampling error happens only as an outcome of using a model from a population instead of than conducting a complete enumeration of the population. It implies a difference between a prediction of the value of community and the ‘true or real’ value of that sample population that would result if a census would be taken. The sampling error does not happen in a census as it is based on the whole community. This error is caused by other factors that are not associated with the sample selection. It implies the existence of any of the factors, whether a random or systematic, that output as the true value of the population. The non-sampling error can happen at any step of a census or study sample. And it is not easily quantified or identified. THE DATA AFFECTS TWO KINDS OF ERROR
WHAT IS THE MARGIN OF ERROR IN STATISTICS? The margin of error in statistics is the order of the values above and below the samples in a given interval. The given range is a method to represent what the suspicious is with a particular statistic.For example, a survey may be referred that there is a 97% confidence interval of 3.88 and 4.89. This means that when a survey would be conducted again with the same technical method, 97% of the time, the real population statistic will lay within the estimated interval (i.e., 3.88 and 4.89) 97% of the time.
STEPS ON CALCULATE MARGIN OF ERROR STEP 1 CALCULATE THE CRITICAL VALUE The critical value is either of a z-score or t-score. In general, for the smaller value (under 30) or when you do not have the standard deviation of the population. Then use a t-score, in another way, use a z-score. STEP 2: CALCULATE THE STANDARD ERROR OR STANDARD DEVIATION. These two are an identical thing, and merely you should have the population parameter value to measure standard deviation. STEP 3: MULTIPLY THE STANDARD DEVIATION AND THE CRITICAL VALUE. 100 students were polled and had a GPA of 2.5 with a standard deviation of 0.5. Calculate the margin of error in statistics for a 90% confidence range.
CONCLUSION This is all about types of error in statistics. Use the details as mentioned earlier, you can understand types of error in statistics. But, still, you find any issue related to the topic error in statistics. Then you can get in touch 24*7 with our professional experts. They have enough knowledge of this particular topic; therefore, they can resolve all the queries of yours. Get the best statistics homework help from the professional experts at a reasonable price. We provide you the assignment before the deadline so that you can check your work. And we also provide a plagiarism-free report which defines the uniqueness of the content. We are providing world-class help on math assignment help to the students who are living across the globe. We are the most reliable math assignment helpers in the world. StattAnalytica
FACEBOOK TWITTER INSTAGRAM @statanalytica @statanalytica @statanalytica We're everywhere!
HOW TO REACH US CONTACT DETAILS OUR HEADQUARTERS Miami, USA WEBSITE https://statanalytica.com EMAIL ADDRESS info@statanalytica.com