Download
1 / 24
240 likes | 381 Views
Proactive Planning for Controlling Staffing Costs in a Down Revenue/Sales Year. Dennis Michael, Ph.D. . Preventing Panic Decisions. My Position. Vice President-Information and Performance Systems Watkins Motor Lines Transportation/Logistics company in Lakeland, FL

E N D
Proactive Planning for Controlling Staffing Costs in a Down Revenue/Sales Year Dennis Michael, Ph.D. Preventing Panic Decisions
My Position • Vice President-Information and Performance Systems • Watkins Motor Lines • Transportation/Logistics company in Lakeland, FL • Close to $1 billion revenue, 120 locations country wide, 8000 employees, 1500 contractors • Privately held by the Watkins Family • Second generation currently head up the company • Third generation gearing up to take over the reins
My Responsibilities • Information Technology • Performance and Operations Systems • Training Development and Delivery • Continuous improvement and quality • Damage and shortage prevention • Profitability/costing system • Industrial Engineering • Strategic Planning
Watkins History • Sustained growth of revenue and profits for over 25 years • Average annual 15-20% growth in revenue, number of locations, and number of employees • Never had an unprofitable year • Never had a company wide layoff • Created a niche with long haul, fast transit, and damage free shipping • Top 25 customers heavily oriented towards computer products, electronics, and retailing
Economy High tech had reached its peak Technology sales slackens NASDAQ begins to tumble Watkins Biggest customers being hit hard Business levels drop Competitors drop prices Profits start to slip Employees start missing bonus payments Situation in Spring of 2001
Strategic Planning Committee • Made up of the Watkins family and core senior executives • Discussions shifted to short term, tactical issues • Presented Objective: Develop a labor cost control contingency plan based on economic/financial conditions
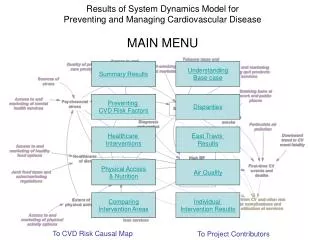
Step 1: Determine Financial Criteria Step 2: Define Financial Stages Step 5: Link Labor Controls to Financial Stages Step 3: Link Financial criteria to Stages Step 4: Determine Labor Cost Controls Labor Cost ControlContingency Planning Model
STEP 1: Determine financial criteria to be utilized • Watkins main financial criteria is our Operating Ratio (OR) • Our measure of profit before taxes and incentives • Calculation formula: Operating Ratio = Expenses/revenue * 100
STEP 1: Financial criteria:Operating Ratio • Bottom Line meaning: • 100.0 OR: revenue = expenses = NO PROFIT • 90.0 OR: Make profit of 10 cents for every $1 in revenue • Watkins Benchmarks for bonuses: • 94.0 OR traditionally had been threshold to pay “regular bonus” • 92.4 OR traditionally had been threshold to pay “super bonus”
STEP 2: Define stages of economic/financial conditions • Factors to consider: • Overall financial results of the company • Availability of new capital funding • Support of lenders to the company • Impact on core business activities • Level of discretionary spending allowed • Labor cost and availability
1. Overall financial results 2. Availability of capital spending 3. Support of Lenders 4. Impact on Core activities 5. Discretionary spending 6. Labor cost/availability --- Excellent profits --- Capital spending increased to support business growth --- Funds are readily available --- Expansion of core and ancillary activities --- Relaxed thresholds for authorization of spending --- Turnover high and labor availability is tight STEP 2: Define Stages Stage 5: PROSPERITY
1. Overall financial results 2. Availability of capital spending 3. Support of Lenders 4. Impact on Core activities 5. Discretionary spending 6. Labor cost/availability --- Average profits --- Capital spending normal --- Funds are available --- Expansion of ancillary activities --- Normal thresholds for authorization of spending --- Turnover increased and labor less available STEP 2: Define Stages Stage 4: CONTINUUM
1. Overall financial results 2. Availability of capital spending 3. Support of Lenders 4. Impact on Core activities 5. Discretionary spending 6. Labor cost/availability --- Profits below expectations --- Capital spending decreased and scrutinized --- Some funds available but borrowing minimized --- Limited impact on core activities --- Tougher thresholds for authorization of spending --- Turnover moderate and labor availability average STEP 2: Define Stages Stage 3: INDIFFERENCE
1. Overall financial results 2. Availability of capital spending 3. Support of Lenders 4. Impact on Core activities 5. Discretionary spending 6. Labor cost/availability --- Little or no profits --- Capital spending restricted --- Limited lending --- Core activities significantly affected --- Tight thresholds for authorization of spending --- Turnover low; labor available STEP 2: Define Stages Stage 2: IMPAIRMENT
1. Overall financial results 2. Availability of capital spending 3. Support of Lenders 4. Impact on Core activities 5. Discretionary spending 6. Labor cost/availability --- Virtually no profits --- No new capital --- Lending in doubt --- Core activities suffering --- No discretionary spending --- Voluntary turnover low; labor readily available STEP 2: Define Stages Stage 1: CRITICAL
Stage 1: Critical Stage 2: Impairment Stage 3: Indifference Stage 4: Continuum Stage 5: Prosperity ---- OR > 98 ---- OR > 96; < 98 ---- OR > 94; < 96; ---- OR > 92; < 94 ---- OR < 92 STEP 3: Link Financial Criteria to Stages of Economic/financial Conditions
STEP 4: Determine Labor Cost Controls That Should Be Considered • Careful review of all positions • Filling new positions • Replacing vacancies in existing positions • Controls on hours worked • Pay increase reductions • Layoffs • Pay increase delays
STEP 5: Link Labor Controls to StagesStage 5: PROSPERITY and Stage 4: CONTINUUM (OR > 94) • Review of HQ positions • New HQ positions identified and justified in budget • Staffing model based on business volume installed in appropriate HQ departments • Filling new positions • Position Review Board (Ex VP-Ops, VP-HR, Controller) reviews and approves all new HQ positions • Filling vacant positions • Director over department approves • Controls on hours worked • Dept. VP approves all hourly overtime hours
STEP 5: Link Labor Controls to Stages Stage 3: INDIFFERENCE (OR > 94; < 96;) • All the controls on reviewing positions remain plus • Filling new positions • Freeze on new HQ salaried and hourly positions • Freeze on new Region/District salaried staff positions • Filling vacant positions • Dept.VP must approve all replacement positions • Controls on hours worked • Voluntary reduction of hours by hourly employees • Voluntary reduction in days/salary for salaried employees • Reduce/eliminate PT employee hours
STEP 5: Link Labor Controls to Stages Stage 3: INDIFFERENCE (OR > 94; < 96) cont. • Pay increase reductions • Reduce HQ salaried and hourly merit increase grid by 1% across the board • Layoffs • Eliminate HQ and field positions directly correlated with business/transaction volume
STEP 5: Link Labor Controls to Stages Stage 2: IMPAIRMENT (OR > 96; < 98) • All Stage 5, 4, and 3 controls remain in place plus • Pay increase reductions • Reduce HQ salaried and hourly merit increase grid by an increased % across the board • Reduce Field salaried and clerical merit increase grid by 1% across the board • Layoffs • Continue to eliminate HQ and field positions directly correlated with business/transaction volume • VPs review organization and recommend/implement staff reductions • Consider early retirement program
STEP 5: Link Labor Controls to Stages Stage 1: CRITICAL (OR > 98) • All Stage 5, 4, 3, and 2 controls remain in place plus • Pay increase reductions • Eliminate merit grids for all positions and give a flat % across the board • Reduce all but the top step increase for all Field hourly line employees on step pay system • If OR > 100, freeze all pay increases • Layoffs • Implement an across the board layoff in all HQ departments based on target % of staff reduction • Eliminate selected staff functional areas (e.g. Internal Audit, Training) • Pay increase delays • Delay pay increases for all positions within the company
Drawbacks New philosophy hard to sell to SPC Executives disliked defining cutoff ORs If plan “leaked out”, it could have severely impacted morale Difficult for Executives to “sort” labor cost controls by Financial stages Benefits Once completed, the contingency plan made business and intuitive sense Guided decision making with little discussion during economic downturn Several times, the plan prevented panic decisions and “knee jerk” reactions Benefits and Drawbacks ofLabor Cost Control Contingency Plan
Where Does Watkins Stand Today? • We just finished our fiscal year 2002 • Our Operating Ratio was 92.5 • This puts us heading back to Stage 1: Prosperity!! • Bonuses are being distributed TODAY!