Download
1 / 18
190 likes | 417 Views
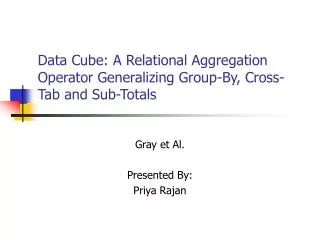
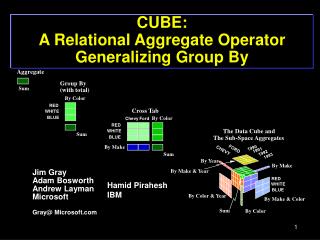
Aggregate. Group By . Sum. (with total). By Color. RED. Cross Tab. WHITE. BLUE. By Color. Chevy. Ford. RED. The Data Cube and . WHITE. Sum. The Sub-Space Aggregates. BLUE. By Make. 1990. FORD. 1991. CHEVY . 1992. Sum. 1993. By Year. By Make. By Make & Year. RED.

E N D
Aggregate Group By Sum (with total) By Color RED Cross Tab WHITE BLUE By Color Chevy Ford RED The Data Cube and WHITE Sum The Sub-Space Aggregates BLUE By Make 1990 FORD 1991 CHEVY 1992 Sum 1993 By Year By Make By Make & Year RED WHITE BLUE By Color & Year By Make & Color Sum By Color CUBE: A Relational Aggregate Operator Generalizing Group By Jim Gray Adam Bosworth Andrew Layman Microsoft Gray@ Microsoft.com Hamid Pirahesh IBM
Spread Sheet Extract analyze Table Price vs Speed Size vs Speed 15 4 10 10 Cache Nearline Offline 1 Tape 12 2 Main Tape 10 10 Secondary Disc $/MB Size(B) Online Online Secondary 9 0 Tape 10 10 Tape Disc visualize Main Offline Nearline Tape Tape 6 -2 10 10 Cache 3 -4 10 10 -9 -6 -3 0 3 -9 -6 -3 0 3 10 10 10 10 10 10 10 10 10 10 Access Time (seconds) Access Time (seconds) The Data Analysis Cycle • User extracts data from database with query • Then visualizes, analyzes data with desktop tools
Division of laborComputation vs Visualization • Relational system builds CUBE relation • aggregation best done close to data • Much filtering of data possible • Cube computation may be recursive • (e.g., percent of total, quartile, ....) • Visualization System displays/explores the cube
Relational Aggregate Operators • SQL has several aggregate operators: • sum(), min(), max(), count(), avg() • Other systems extend this with many others: • stat functions, financial functions, ... • The basic idea is: • Combine all values in a column • into a single scalar value. • Syntax select sum(units) from inventory;
Relational Group By Operator • Group By allows aggregates over table sub-groups • Result is a new table • Syntax: select location, sum(units) from inventory group by location having nation = “USA”;
sum M T W T F S S AIR HOTEL FOOD MISC Problems With This Design • Users Want Histograms • Users want sub-totals and totals • drill-down & roll-up reports • Users want CrossTabs • Conventional wisdom • These are not relational operators • They are in many report writers and query engines F() G() H()
Thesis: The Data CUBE Relational Operator Generalizes Group By and Aggregates
The Idea: Think of the N-dimensional CubeEach Attribute is a Dimension • N-dimensional Aggregate (sum(), max(),...) • fits relational model exactly: • a1, a2, ...., aN, f() • Super-aggregate over N-1 Dimensional sub-cubes • ALL, a2, ...., aN , f() • a3 , ALL, a3, ...., aN , f() • ... • a1, a2, ...., ALL, f() • this is the N-1 Dimensional cross-tab. • Super-aggregate over N-2 Dimensional sub-cubes • ALL, ALL, a3, ...., aN , f() • ... • a1, a2 ,...., ALL, ALL, f()
An Example CUBE
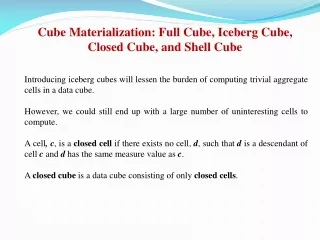
Why the ALL Value? • Need a new “Null” value (overloads the null indicator) • Value must not already be in the aggregated domain • Can’t use NULL since may aggregate on it. • Think of ALL as a token representing the set • {red, white, blue}, {1990, 1991, 1992}, {Chevy, Ford} • Rules for “ALL” in other areas not explored • assertions • insertion / deletion / ... • referential integrity • Follow “set of values” semantics.
CUBE operator: Syntax • Proposed syntax: • Note: Group By operator repeats aggregate list • in select list • in group by list select model, make, year, sum(units) from car_sales where model in {“chevy”, “ford”} and year between 1990 and 1994 group by model, make, year with cube having sum(units) > 0;
block city county state nation second minute hour day week month quarter year Xmas Easter Thanksgiving Holiday Decorations and Abstractions • Sometimes want to tag cube with redundant values • region #, region_name, sales • region name is not a dimension, it is a decoration • Decorations are functionally dependent on dimensions • More interesting, some “dimensions” are aggregations. • Often these aggregations are not linear (are a lattice) • Rather than treat time as 12 dimensions • Recognize abstractions as one dimension (like decorations) • Compute efficiently (virtual functions)
Interesting Aggregate Functions • From RedBrick systems • Rank (in sorted order) • N-Tile (histograms) • Running average (cumulative functions) • Windowed running average • Percent of total • Users want to define their own aggregate functions • statistics • domain specific
User Defined Aggregates • Idea: • User function is called at start of each group • Each function instance has scratchpad • Function is called at end of group • Example: SUM • START: allocates a cell and sets it to zero • NEXT: adds next value to cell • END: deallocates cell and returns value • Simple example: MAX() • This idea is in Illustra, IBM’s DB2/CS, and SQL standard • Needs extension for rollup and cube start next Scratchpad end
User Defined Aggregate Function Generalized For Cubes • Aggregates have graduated difficulty • Distributive: can compute cube from next lower dimension values (count, min, max,...) • Algebraic: can compute cube from next lower lower scratchpads (average, ...) • Holistic: Need base data (Median, Mode, Rank..) • Distributive and Algebraic have simple and efficient algorithm: build higher dimensions from core • Holistic computation seems to require multiple passes. • real systems use sampling to estimate them • (e.g., sample to find median, quartile boundaries)
How To Compute the Cube? • If each attribute has Ni values CUBE has P (Ni+1) values • Compute N-D cube with hash if fits in RAM • Compute N-D cube with sort if overflows RAM • Same comments apply to subcubes: • compute N-D-1 subcube from N-D cube. • Aggregate on “biggest” domain first when >1 deep • Aggregate functions need hidden variables: • e.g. average needs sum and count. • Use standard techniques from query processing • arrays, hashing, hybrid hashing • fall back on sorting.
Example: • Compute 2D core of 2 x 3 cube • Then compute 1D edges • Then compute 0D point • Works for algebraic and distributive functionsSaves “lots” of calls
Summary • CUBE operator generalizes relational aggregates • Needs ALL value to denote sub-cubes • ALL values represent aggregation sets • Needs generalization of user-defined aggregates • Decorations and abstractions are interesting • Computation has interesting optimizations Research Topics • Generalize Spreadsheet Pivot operator to RDBs • Characterize Algebraic/Distributive/Holistic functions for update