Download
1 / 31
580 likes | 1.68k Views
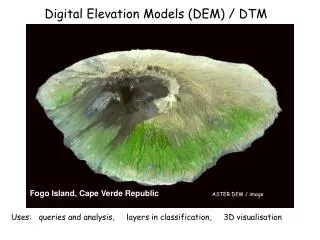
Digital Elevation Models (DEM) / DTM. Fogo Island, Cape Verde Republic ASTER DEM / image. Uses: queries and analysis, layers in classification, 3D visualisation. DEM data sources. Almost all DEMs have been created from remote sensing: a. DEMs from digitising contours (e.g. NTDB)

E N D
Digital Elevation Models (DEM) / DTM Fogo Island, Cape Verde RepublicASTER DEM / image Uses: queries and analysis, layers in classification, 3D visualisation
DEM data sources Almost all DEMs have been created from remote sensing: a. DEMs from digitising contours (e.g. NTDB) The earliest were created by digitising contours on maps into layers stereo photos -> contour lines -> digitised lines -> convert to raster b. Digital Stereo photogrammetry: (e.g. BC TRIM) Mass points captured from aerial photographs stereo photos -> mass points -> convert to raster
BC TRIM DEM Interpolated to 25m grid By 1:250,000 map sheets (100 tiles assembled together) Vertical accuracy to within 10metres UTM pixel coordinates to even 25m Resampled to BC Albers 16 bit codes, -9999 for invalid numbers e.g. across border into AB
Post 2000 methods • c. Direct image grid DEM data from imagery • RADAR (interferometry) e.g. Shuttle Radar Topographic Mission (SRTM) • Stereo aerial photos, and optical satellite imagery from path overlap
DEM availability A DEM is a continuous grid of elevation values – one height value per pixel ….. in a channel (not a band) AGENCY SCALE RESOLUTION (metres) Municipal 1: 2,000 1 Provincial 1: 20,000 25 Federal 1: 50,000 50 Federal 1: 250,000 200 Global 1: 1,000,000 500-1000 Download Canadian data from geobase.ca (1:50,000 / 1:25,000) * BC is provincial data (25m) resampled for NTDB (50m)
DEM sources: global GTOPO30 ~1993 1km http://edc.usgs.gov/products/elevation/gtopo30/gtopo30.html
SRTM (Shuttle Radar Topographic Mission) Feb 2000 90 metre pixels, 60ºS-60ºN latitude e.g. Google Earth
DEM layers a. Elevation DN = (metres, 16 bit): represented as grayscale or pseudocolour tints; Raster DEMs are stored as elevations (metres) or 32 bit (after interpolation) some DEM tiles in Canada may be in feet (how would the values compare ?) conversion = .3048
b. Shaded relief A cartographic layer, DN= 0 - 255 (relative amount of light reflected), as grayscale; light source can be selected, usually from the NW. High values on NW facing slopes, low values on SE facing slopes. Also useful for detecting errors and assessing quality
BC provincial DEM 1985 (1981-1989) – Homathko Icefield - mapplace.ca or lrdw.ca
c. Slope Calculated in degrees (0-90) or % (0 -> infinity) slope is rise/run = vertical change over the horizontal distance 8 bit results should be adequate for most purposes
4. Aspect The direction in which a slope is facing, measured by azimuth (0-360) This raises three question for analysis: a north facing slope has both extreme values, 0 and 360 flat slopes have no value (they are given an arbitrary numerical value, e.g. 555) 0-360 requires 16 bit data; some software (PCI) converts to 8 bit by dividing by 2
5. Incidence Image data look similar to shaded relief, but with values 0-90 the angle (degree) of light incidence for each pixel, based on the sun position at time of scene capture. Requires knowledge of sun elevation and azimuth for the scene = metadata (file acquired with scene data)
6. Second derivatives: slope concavity and convexity, used in generating watersheds and also viewsheds using line of sight
7. 3D perspectives / fly-throughs e.g. Google Earth etc..
Directed high res sensors- Ikonos 1999 4 m http://www.satimagingcorp.com/galleryimages/ikonos-high-resolution-dem-eritrea.jpg
DEM products Elevation 0- ? 16 bit Hillshading 0-255 Slope 0-90 (if in degrees) Aspect 0-359 16 bit Visual: Anaglyphs and 3D perspectives
Can DEMs Enhance Digital Image Classification? SPOT image data http://www.gisdevelopment.net/aars/acrs/1997/ts9/ts9007pf.htm
DEM summary • Use of DEMs / DTMs: • queries and analysis • layers in classification • 3D modelling and visualisation • Resolutions and datasets available: • NTDB 50m • TRIM 25m (BC only) • ASTER 30m (global) • SRTM 90m (near global) • GTOPO30 1km (global)
LiDAR DEM 2009 – UNBC area: (Light Detection And Ranging) Resolution 50 cm Flooded PG bowl image by Shane ~ 10,000 BP
The UNBC Geowall In lab this week