Download
1 / 32
320 likes | 537 Views
The Clinical Significance of Echo Signal Attenuation on Intravascular Ultrasound in Patients with Coronary Artery Disease. Name : Shigeki Kimura , MD 1) Tsunekazu Kakuta, MD 2) Taishi Yonetsu, MD 2) Asami Suzuki, MD 2) Yoshito Iesaka, MD 2)

E N D
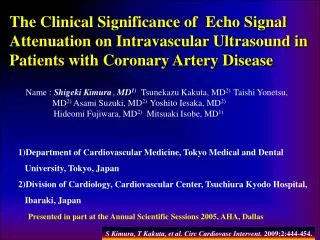
The Clinical Significance of Echo Signal Attenuation on Intravascular Ultrasound in Patients with Coronary Artery Disease Name : Shigeki Kimura ,MD1)Tsunekazu Kakuta, MD2) Taishi Yonetsu, MD2) Asami Suzuki, MD2) Yoshito Iesaka, MD2) Hideomi Fujiwara, MD2) Mitsuaki Isobe, MD1) 1)Department of Cardiovascular Medicine, Tokyo Medical and Dental University, Tokyo, Japan 2)Division of Cardiology, Cardiovascular Center, Tsuchiura Kyodo Hospital, Ibaraki, Japan Presented in part at the Annual Scientific Sessions 2005, AHA, Dallas S Kimura, T Kakuta, et al. Circ Cardiovasc Intervent. 2009;2:444-454.
Presenter Disclosure Information Name : Shigeki Kimura, MD, Tsunekazu Kakuta, MD Taishi Yonetsu, MD, Asami Suzuki, MD Yoshito Iesaka, MD, Hideomi Fujiwara, MD Mitsuaki Isobe, MD Nothing to Disclose Related to This Presentation
Backgrounds1 Atherosclerotic plaque that shows echo signal attenuation (EA) without associated bright echoes is sometimes observed by intravascular ultrasound (IVUS), although its clinical significance remains unclear. Okura et al. reported that atherosclerotic plaque with ultrasonic attenuation (EA) may be related to a transient deterioration in coronary flow during PCI in patients with acute coronary syndrome (ACS) Circ J. 2007;71:648-653
Backgrounds 2 A recent IVUS study reported that high level CRP, angiographic thrombus, deteriorated initial coronary flow, greater plaque burden, positive remodeling and plaque rupture were associated with attenuated plaque, and post-PCI no-reflow were frequent in ACS lesions with attenuated plaque. No attenuated plaque was observed in lesions with stable angina pectoris. JACC Cardiovasc Interv.2009;2:65-72 Several histopathological studies suggested that the presence of microcalcification and lipid rich plaque components might be associated with echo attenuation. Acute Cardiac Care. 2006;8 110-112 J Cardiol 2007 50 (4) 223-228
Aims To investigate the impact of EA on coronary perfusion and clinical outcome after PCI in patients with coronary artery disease. Further, to evaluate the pathological features of plaque with EA obtained by DCA
Method 1 Six hundred and eighty seven lesions in 687 consecutive patients (535 men and 152 women) who underwent preintervention IVUS were investigated. Exclusion: *in-stent restenotic lesions *bypass graft lesions *multiple culprit lesions *heavily calcified lesions *lesions treated with Rotablator or distal protection devices
Method 2 Quantitative coronary angiography was performed with a CMS-MEDIS system (Medis Medical Imaging System, Leiden, The Netherlands) Coronary flow was assessed according to Thrombolysis in Myocardial infarction (TIMI) flow grade and corrected TIMI frame count (CTFC) Angiographic no reflow was defined as TIMI grade 0-2 Myocardial perfusion was assessed by the myocardial blush grade (MBG)
Method 3 IVUS : Commercially available IVUS system, 40-MHz Boston Scientific Corporation/SciMed Automatic pullback of 0.5mm/s Plaque morphologies were qualitatively and quantitatively analyzed by two experienced observer according to the American College of Cardiology Clinical Expert Consensus Document on IVUS The culprit lesion was defined as the site of the smallest lumen and the reference site was set at the most normal looking region within 10mm proximal to it J Am Coll Cardiol. 2001; 37:1478-1492
Methods 4 Definition of echo signal attenuation on IVUS IVUS findings showing ultrasound signal attenuation without very high intensity echo reflectors that involved >90 degrees of the vessel circumference and involved of >1mm
Method 5 All lesions were divided into two groups. (Group A: lesions with EA, Group NA: lesions without EA) Between the two groups, the differences in patient characteristics and lesion morphologies were compared. By subgroup analysis, 60 DCA samples (30 with EA and 30 without EA) underwent pathological examination Coronary flow after PCI and clinical outcome were compared between the two groups (DCA lesions were excluded from the analysis of coronary flow)
Method 6 The relationship between no reflow (TIMI 0-2) after PCI, EA and other variables (clinical characteristics, coronary risk factors, lesion morphologies on IVUS, angiographic characteristics, interventional strategies, and medications) was evaluated by multivariate logistic regression analysis
Methods 7 Pathological assessment DCA was performed with IVUS guidance Directional removal of the plaque with EA was intended DCA samples were immediately immersion-fixed in 10% buffered formalin and embedded in paraffin These segments were stained with hematoxilin-eosin, Von Kossa stain and immunostaing with an anit-CD 68 antibody (M814 DAKO)
Methods 8 In each lesion, the percent areas of the following 4 tissues were measured and averaged: (1) fibrous tissue (few cells and dense collagen fibers) (2) lipid-rich atheromatous tissue (foam cells, cholesterol clefts, and acellular debris) (3) hypercellular tissue (a loose connective tissue matrix containing numerous stellate cells) (4) thrombus (fibrin deposits) Circulation.2000;102:2180–2184 Fibrous tissue Hypercellular tissue Thrombus Lipid rich atheromatous tissue
Methods 9 In addition, the presence of the following components wassemi-quantitatively graded (0; absent, 1:sparse, and 2 abundant) and the mean grade for each lesion was calculated: macrophages, cholesterol clefts, hemosiderin, microcalcification (small calcium flecks <50 µ in diameter), and dense calcification (larger calcified masses Macrophages Cholesterol cleft Microcalcification Dense calcification Hemosiderin
Results 1 EA was detected in 245 lesions (35.7%) The frequency of EA was significantly higher in ACS than in SAP (43.8% in ACS vs. 27.9% in SAP, p<0.001) Patient characteristics ACS (336) SAP (351) A (n=98) NA (n=253) P A (n=147) NA (n=189) P Age (yrs) 66±14 64±12 ns 66±11 65±10 ns Female gender 33 (22.5%) 38(20.1%) ns 19 (19.4%) 62 (24.5%) ns Current Smoker 67 (45.6%) 82 (43.4%) ns 31 (31.6%) 73 (28.9%) ns Diabetes mellitus 54 (36.7%) 56 (29.6%) ns 34 (34.7%) 115 (45.5%) ns Hyperlipidemia 67 (45.6%) 96 (50.8%) ns 54 (55.1%) 160 (63.2%) ns Hypertention 95 (64.6%) 124 (65.6%) ns 71 (72.5%) 179 (70.8%) ns Previous myocardial infarction 18 (12.2%) 24 (12.7%) ns 50 (51.0%) 108 (42.7%) ns Aspirin use 46 (31.3%) 73 (38.6%) ns 84 (85.7%) 231 (91.3%) ns Ticlopidine use 34 (23.1%) 48 (25.4%) ns 60 (61.2%) 167 (66.0%) ns Statins use 38 (25.9%) 44 (23.3%) ns 45 (45.9%) 141 (55.7%) ns ACS: acute coronary syndrome, SAP: stable angina pectoris A : echo attenuation, NA: non-attenuation
Results 2 Angiographic lesion characteristics ACS SAP A (n=98) NA (n=253) P A (n=147) NA (n=189) P LAD/RCA/LCX/LMT 76/51/20/0 86/70/25/8 ns 19/46/26/7 102/87/53/11 p<0.05 B2/C* 106 (72.1%) 129 (68.3%) ns 50 (51.0%) 148 (58.5%) ns Pre-RD (mm) 3.0 ± 0.7 2.8 ± 0.6 p<0.05 2.9 ± 0.6 2.8 ± 0.6 p<0.05 Pre-MLD (mm) 0.9 ± 0.6 0.9 ± 0.6 ns 1.4 ± 0.4 1.4 ± 0.4 ns Lesion length (mm) 18.0 ± 5.8 17.5 ± 5.9 ns 16.5 ± 5.1 16.2 ± 5.7 ns LV EF<40% 20 (13.6%) 17 ( 9.0%) ns 7 ( 7.1%) 18 ( 7.1%) ns Pre-TIMI** (0~2) 92 (62.6%) 107 (56.6%) ns 4 ( 4.1%) 11 ( 4.3%) ns ACS: acute coronary syndrome, SAP: stable angina pectoris, A : echo attenuation, NA: non-attenuation LAD, left anterior descending artery; RCA, right coronary artery; LCX, left circumflex artery; LMT, left main trunk *Lesion complexity was assessed according to the modified classification of the ACC/AHA. **TIMI: Thrombolysis in Myocardial Infarction (TIMI) flow grade RD: reference diameter, MLD: minimal lumen diameter, EF: ejection fraction
Results 3 Quantitative Coronary Ultrasound ACS SAP A (n=147) NA (n=189) P A (n=98) NA (n=253) P Reference EEM CSA 18.2 ± 6.4 16.3 ± 4.9 p<0.01 16.4 ± 4.7 14.5 ± 5.2 p<0.01 (mm2) Lesion EEM CSA 18.9 ± 5.7 15.2 ± 5.2 p<0.001 16.8 ± 5.4 12.8 ± 4.6 p<0.001 (mm2) Lesion lumen CSA 2.1 ± 0.7 2.2 ± 0.8 ns 2.5 ± 1.0 2.3 ± 1.0 ns (mm2) Lesion plaque area 16.7± 5.5 13.1 ± 5.0 p<0.001 14.3 ± 5.4 10.5 ± 4.1 p<0.001 (mm2) Lesion plaque burden* 88.5 86.0 p<0.001 84.4 81.6 p<0.001 (%) (85.9 to 91.0) (80.4 to 89.4) (81.0 to 88.8) (77.0 to 85.6) ACS: acute coronary syndrome, SAP: stable angina pectoris, A : echo attenuation, NA: non-attenuation EEM: external elastic membrane, CSA: cross sectional area *Plaque area divided by (EEM-CSA) x100, presented as medians with interquartile ranges.
Results 4 Lesion Morphologies in IVUS ACS SAP P A (n=147) NA (n=189) P A (n=98) NA (n=253) Positive remodeling 81 (55.1%) 44 (23.3%) p<0.001 44 (44.9%) 59 (23.3%) p<0.001 Eccentricity 125 (85.0%) 132 (69.8%) p<0.05 86 (87.8%) 188 (74.3%) p<0.01 Thrombus 78 (53.1%) 105 (55.6%) ns 8 ( 8.2%) 7 ( 2.8%) p<0.05 Lipid core 39 (26.5%) 37 (19.6%) ns 22 (22.4%) 26 ( 10.3%) p<0.01 Ruptured plaque 83 (56.5%) 110 (58.2%) ns 23 (23.5%) 41 (16.2%) ns Mild Calcification* 71 (48.3%) 37 (19.6%)p<0.001 50 (51.0%) 71 (28.1%) p<0.001 ACS: acute coronary syndrome, SAP: stable angina pectoris A : echo attenuation, NA: non-attenuation *presence of Mild Calcification was defined as having calcification with less than 90゜in IVUS
Results 5 TIMI flow grade during PCI Baseline Final ACS % NS P<0.001 100 80 30.2 78.3 96.0 38.9 60 29.5 26.8 40 8.5 10.3 20 31.8 24.0 19.4 0 2.3 4.0 A NA A NA TMG 0 SAP P=0.03 % NS 100 TMG 1 95.4 80 95.3 94.2 98.7 TMG 2 60 40 TMG 3 20 0 3.5 4.2 0.4 4.7 1.3 1.2 1.1 A NA A NA
Results 6 Frequencies of inadequate coronary flow during PCI (CTFC>40) ACS SAP NS % % 60 60 51.1 43.4 40 40 P<0.001 20 20 NS P<0.001 10.1 3.5 0.6 2.3 1.3 0.0 0 0 Baseline Final Baseline Final Group A Group NA
Results 7 Myocardial blush grade during PCI Baseline Final ACS NS P<0.001 % 100 20.1 27.4 45.7 64.6 80 23.3 25.7 60 17.1 11.4 40 42.6 33.1 20 39.5 35.5 6.2 0 5.5 2.3 A NA NA A MBG 0 100 P<0.001 NS % SAP 80 MBG 1 87.2 85.7 67.4 89.0 60 MBG 2 40 MBG 3 20 31.4 9.3 11.8 11.0 0 1.2 2.3 2.1 0.4 1.2 A NA A NA
Results 8 Frequencies of Peri-Procedural Myocardial Damage Procedural MN* Procedural MI** % P<0.05 P<0.05 % P<0.001 P<0.01 60 60 48.9 40 40 32.6 19.8 16.9 17.0 20 20 9.3 4.9 3.0 0 0 UAP SAP UAP SAP *Myocardial necrosis: elevation of creatine kinase after PCI above the 99th percentile of the reference range **Myocaridal infarction: elevation of creatine kinase after PCI by more than 3 times the uppser limit of the reference range Group A Group NA
Results 9 Clinical outcome During 1 Year of Follow-up ACS SAP A (n=119) NA (n=159) P A (n=84) NA (n=229) P Fatal arrhythmia 3 ( 2.5) 0 ( 0.0) ns 0 ( 0.0) 0 ( 0.0) ns CHF* 9 ( 7.6) 3 ( 1.9) p<0.05 4 (4.8) 3 (1.3) ns Disabling stroke 1 (0.8) 0 ( 0.0) ns 0 (0.0) 0 (0.0) ns Reinfarction 1 (0.8) 0 (0.0) ns 0 (0.0) 1 (0.4) ns Ischemic TVR** 9 (7.6) 7 (4.4) ns 1 (1.2) 7 (3.1) ns Cardiac surgery 0 (0.0) 1 (0.6) ns 1 (1.2) 0 (0.0) ns Cardiac death 0 (0.0) 0 (0.0) ns 0 (0.0) 0 (0.0) ns MACE † 9 (7.6) 7 (4.4) ns 1 (1.2) 7 (3.1) ns Total Cardiac Events‡ 20 (16.8) 10 (6.3) p<0.01 5 (6.0) 9 (3.9) ns ACS: acute coronary syndrome, SAP: stable angina pectoris, A : echo attenuation, NA: non-attenuation *congestive heart failure, ** target vessel revascularization, †Cardiac death, ischemic TVR, or reinfarction. ‡MACE, cardiac surgery, fatal arrhythmia, congestive heart failure, or unstable angina
Results 10 Univariate analysis for worse coronary flow after PCI Frequency of TIMI 0-2 after PCI (%) Variable Factor Present Factor Absent OR (95% CI) P Baseline TIMI 0 to 2 15.6 2.4 7.47 (3.60 to 15.48) p<0.001 Echo signal attenuation 15.4 2.4 7.29 (3.52 to 15.11) p<0.001 Acute coronary syndrome 11.5 2.5 5.12 (2.34 to 11.23) p<0.001 Primary aspiration 15.0 3.7 4.55 (2.40 to 8.62) p<0.001 Ruptured plaque 12.7 3.1 4.47 (2.25 to 8.88) p<0.001 Thrombus (IVUS) 14.4 3.8 4.27 (2.26 to 8.88) p< 0.001 Large reference area* 10.8 2.9 4.07 (1.92 to 8.64) p<0.001 Current smoker 11.4 4.4 2.77 (1.48 to 5.20) p<0.001 Ejection fraction <40% 15.0 6.0 2.77 (1.26 to 6.09) 0.02 Large plaque burden† 9.9 3.8 2.75 (1.38 to 5.46) 0.003 Positive remodeling 11.2 4.7 2.54 (1.36 to 4.74) 0.003 Lipid core 11.1 6.0 1.97 (0.98 to 3.97) 0.055 LAD 9.3 5.4 1.80 (0.97 to 3.35) 0.061 Long lesion** 8.6 5.1 1.76 (0.93 to 3.33) 0.08 Previous MI 3.7 8.2 0.43 (0.19 to 0.98) 0.058 Statins 3.7 8.9 0.39 (0.18 to 0.82) 0.02 Ticlopidine 2.7 10.6 0.23 (0.11 to 0.51) p<0.001 Aspirin 3.3 13.9 0.21 (0.11 to 0.41) p<0.001 *reference area: > median**Lesion length > median, ACS: acute coronary syndrome
Results 11 Multivariate analysis for worse coronary flow after PCI Variable Coefficient Standard Error OR(95% CI) P Baseline TIMI0-2 1.78 0.38 5.91 (2.79~12.51) p<0.001 Echo signal attenuation 1.72 0.38 5.59 (2.64~11.85) p<0.001 Large reference area* 1.12 0.40 3.08 (1.40~ 6.76) 0.005 *plaque area > median, OR: odds ratio, CI: confidence interval, TIMI: Thrombolysis in Myocardial Infarction(TIMI) flow grade
Results 12 Mean Percentage Area of Each Plaque Component P<0.01 % 80 74.5 60 55.7 40 P<0.001 ns 18.5 20.5 20 9.5 P<0.05 2.4 0.7 0 0 Atheromatous tissue Fibrous tissue Hypercellular tissue Thrombus Group A Group NA
Results 13 Comparison of the mean grade of each plaque component With EA Without EA P Macrophages 1.2±0.8 0.7±0.7 p<0.01 Cholesterol clefts 1.5±0.7 0.8±0.7 p<0.001 Hemosiderin 0.7±0.8 0.3±0.6 ns Microcalcification 1.4±0.8 0.8±1.0 p<0.01 Dense calcification 0.7±0.9 0.8±0.9 ns
Representative case (Female, 62 y.o) Target lesion was detected in left circumflex artery. DCA was performed. Stent was implanted. Echo signal attenuation was detected. Post DCA Pre DCA
Pathological findings H-E Lipid rich plaque Microcalcium deposit, cholesterol clefts and acellular debris were observed. Presented at the Annual Scientific Sessions 2005 of the American Heart Association, Dallas
CD 68 Berlin Blue CD 36 CRP-8 The plaque was strongly stained by CD 68, CD36, Berlin Blue, CRP-8, respectively Presented at the Annual Scientific Sessions 2005 of the American Heart Association, Dallas
In Summary * EA was significantly more frequent in the culprit lesions of ACS than in those of SAP Coronary flow and myocardial perfusion after PCI were worse and the frequency of myocardial damage was higher in patients with either ACS or SAP whose culprit lesion showed EA on IVUS Multivariate analysis revealed a significant association between no reflow after PCI and EA along with a baseline TIMI grade 0-2 and a large reference area by IVUS EA was predominantly found in lesions from vessels with a large reference diameter and significant plaque burden. Lesions with EA showed a high frequency of positive remodeling, eccentricity, and mid calcification<90 degrees Histopathological examination of specimens obtained by DCA revealed a significantly higher prevalence of lipid-rich plaque, macrophage infiltration, cholesterol clefts, thrombus, and microcalcification in lesions with EA than in those without * * * * S Kimura, T Kakuta, et al. Circ Cardiovasc Intervent. 2009;2:444-454.
Conclusion EA was detected in 35.7% of the culprit plaques, and was more common in patients with ACS than with SAP. Detection of EA in culprit lesions was a strong independent predictor of no reflow after PCI. EA might indicate that a lesion contains high-risk plaque components that are susceptible to distal embolization. S Kimura, T Kakuta, et al. Circ Cardiovasc Intervent. 2009;2:444-454.