Download
1 / 44
440 likes | 610 Views
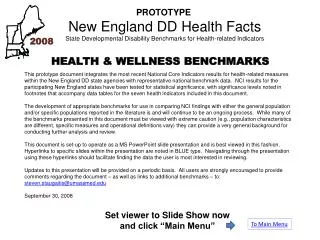
PROTOTYPE New England DD Health Facts State Developmental Disability Benchmarks for Health-related Indicators. 2008. HEALTH & WELLNESS BENCHMARKS.

E N D
PROTOTYPE New England DD Health Facts State Developmental Disability Benchmarks for Health-related Indicators 2008 HEALTH & WELLNESS BENCHMARKS This prototype document integrates the most recent National Core Indicators results for health-related measures within the New England DD state agencies with representative national benchmark data. NCI results for the participating New England states have been tested for statistical significance, with significance levels noted in footnotes that accompany data tables for the seven health indicators included in this document. The development of appropriate benchmarks for use in comparing NCI findings with either the general population and/or specific populations reported in the literature is and will continue to be an ongoing process. While many of the benchmarks presented in this document must be viewed with extreme caution (e.g., population characteristics are different, specific measures and operational definitions vary) they can provide a very general background for conducting further analysis and review. This document is set-up to operate as a MS PowerPoint slide presentation and is best viewed in this fashion. Hyperlinks to specific slides within the presentation are noted in BLUE type. Navigating through the presentation using these hyperlinks should facilitate finding the data the user is most interested in reviewing. Updates to this presentation will be provided on a periodic basis. All users are strongly encouraged to provide comments regarding the document – as well as links to additional benchmarks – to: steven.staugaitis@umassmed.edu September 30, 2008 Set viewer to Slide Show now and click “Main Menu” To Main Menu
PROTOTYPE New England DD Health Facts State Developmental Disability Benchmarks for Health-related Indicators 2008 HEALTH & WELLNESS BENCHMARKS CURRENT Data and Benchmarks from 2007 NCI and General Population Statistics FUTURE Data and Benchmarks proposed for future NCI – to be available in 2009 Annual Physical (Health) Exams Annual Ob/Gyn Exams Dental Exams/ Visits Physical Activity Tobacco Use Weight Concerns Psychotropic Drug Utilization Vision examination Hearing examination Flu vaccination Pneumonia vaccination Pelvic examination (F) Mammogram (F) PSA test (M) Colorectal cancer screening Falls evaluation Serious injury from fall Treatment for depression “click” category to review data
Back to Main Menu New England DD Health Facts State Developmental Disability Benchmarks for Health-related Indicators 2008 HEALTH & WELLNESS BENCHMARKS Directions: You must run the presentation in PowerPoint SLIDE SHOW in order to activate the hyperlinks. This will allow you to simply “click” on a link in order to be brought to the desired slide. Links are printed in BLUE and underlined. Each slide has a BACK TO link or series of links in the upper right hand corner. Use these to return to either the main menu or the slide with data on all the participating New England states for each major category.
New England DD Health Facts State Developmental Disability Benchmarks MEDICAL EXAMS Back to Main Menu Indicator: Percent of adults with a physical exam within the past year. Click link for state charts link link link link
New England DD Health Facts State Developmental Disability Benchmarks GYN EXAMS Back to Main Menu Indicator: Percent of adult women with a Ob/Gyn exam within the past year. Click link for state charts link link link
New England DD Health Facts State Developmental Disability Benchmarks DENTAL Back to Main Menu Indicator: Percent of adults who have had a dental visit within the past six months. [Note: NCI = visit within 6 mo., general population benchmarks = visit within 1 year.] Click link for state charts link link link link
New England DD Health Facts State Developmental Disability Benchmarks PHYSICAL ACTIVITY Back to Main Menu Indicator: Percent of adults who are physically inactive. Click link for state charts link link link Also see: JAMA. Vol. 299 No. 1, January 2, 2008, 30-32. Prevalence of Regular Physical Activity Among Adults—United States, 2001 and 2005. Report from the Centers for Disease Control and Prevention: Morbidity and Mortality Weekly Report (MMWR) 2007; 56:1209-1212.
New England DD Health Facts State Developmental Disability Benchmarks TOBACCO USE Back to Main Menu Indicator: Percent of adults who smoke/use tobacco. Click link for state charts link link link
New England DD Health Facts State Developmental Disability Benchmarks WEIGHT Back to Main Menu Indicator: Percent of adults who are overweight. Click link for state charts link link link
New England DD Health Facts State Developmental Disability Benchmarks PSYCHOTROPIC DRUG UTILIZATION Back to Main Menu MEDICATIONS FOR: Mood Disorders Anxiety Behavior Problems Psychotic Disorders When finished, exit Slide Show (Esc key)
New England DD Health Facts State Developmental Disability Benchmarks PSYCHOTROPIC MEDICATION MOOD DISORDERS Back to Psychotropic Drugs Back to Main Menu Indicator: Percent of adults who use psychotropic medication for a mood disorder. [Note: benchmark for general population NOT directly comparable to NCI.] Click link for state charts link link
New England DD Health Facts State Developmental Disability Benchmarks PSYCHOTROPIC MEDICATION ANXIETY Back to Psychotropic Drugs Back to Main Menu Indicator: Percent of adults who use psychotropic medication for anxiety. [Note: benchmark for general population NOT directly comparable to NCI.] Click link for state charts link link
New England DD Health Facts State Developmental Disability Benchmarks PSYCHOTROPIC MEDICATION BEHAVIOR Back to Psychotropic Drugs Back to Main Menu Indicator: Percent of adults who use psychotropic medication for behavior problems. [Note: no comparable general population benchmark.] Click link for state charts link link
New England DD Health Facts State Developmental Disability Benchmarks PSYCHOTROPIC MEDICATION PSYCHOTIC DISORDERS Back to Psychotropic Drugs Back to Main Menu Indicator: Percent of adults who use psychotropic medication for psychotic disorders. Click link for state charts link link
New England DD Health Facts State Developmental Disability Benchmarks Back to Physical Exams Back to Main Menu State: Connecticut - DDS Indicator: Percent of adults with a physical exam within the past year. REFERENCES: 1 NCI: New England State Results (2006-2007). Special report prepared by HSRI, September 12, 2008. 2 Mehrotra A, Zaslavsky A & Ayanian, J. Preventive health examinations and preventive gynecological examinations in the United States. Arch Intern Med. 2007;167(17):1876-1883
New England DD Health Facts State Developmental Disability Benchmarks Back to Physical Exams Back to Main Menu State: Maine - OACPDS Indicator: Percent of adults with a physical exam within the past year. REFERENCES: 1 NCI: New England State Results (2006-2007). Special report prepared by HSRI, September 12, 2008. 2 Mehrotra A, Zaslavsky A & Ayanian, J. Preventive health examinations and preventive gynecological examinations in the United States. Arch Intern Med. 2007;167(17):1876-1883
New England DD Health Facts State Developmental Disability Benchmarks Back to Physical Exams Back to Main Menu State: Rhode Island - DDD Indicator: Percent of adults with a physical exam within the past year. REFERENCES: 1 NCI: New England State Results (2006-2007). Special report prepared by HSRI, September 12, 2008. 2 Mehrotra A, Zaslavsky A & Ayanian, J. Preventive health examinations and preventive gynecological examinations in the United States. Arch Intern Med. 2007;167(17):1876-1883
New England DD Health Facts State Developmental Disability Benchmarks Back to Physical Exams Back to Main Menu State: Vermont - DAIL Indicator: Percent of adults with a physical exam within the past year. REFERENCES: 1 NCI: New England State Results (2006-2007). Special report prepared by HSRI, September 12, 2008. 2 Mehrotra A, Zaslavsky A & Ayanian, J. Preventive health examinations and preventive gynecological examinations in the United States. Arch Intern Med. 2007;167(17):1876-1883
New England DD Health Facts State Developmental Disability Benchmarks Back to Ob/Gyn Exams Back to Main Menu State: Connecticut - DDS Indicator: Percent of adult women with an ob/gyn exam within the past year. REFERENCES: 1 NCI: New England State Results (2006-2007). Special report prepared by HSRI, September 12, 2008. 2 Mehrotra A, Zaslavsky A & Ayanian, J. Preventive health examinations and preventive gynecological examinations in the United States. Arch Intern Med. 2007;167(17):1876-1883
New England DD Health Facts State Developmental Disability Benchmarks Back to Ob/Gyn Exams Back to Main Menu State: Maine - OACPDS Indicator: Percent of adult women with an ob/gyn exam within the past year. REFERENCES: 1 NCI: New England State Results (2006-2007). Special report prepared by HSRI, September 12, 2008. 2 Mehrotra A, Zaslavsky A & Ayanian, J. Preventive health examinations and preventive gynecological examinations in the United States. Arch Intern Med. 2007;167(17):1876-1883
New England DD Health Facts State Developmental Disability Benchmarks Back to Ob/Gyn Exams Back to Main Menu State: Rhode Island - DDD Indicator: Percent of adult women with an ob/gyn exam within the past year. REFERENCES: 1 NCI: New England State Results (2006-2007). Special report prepared by HSRI, September 12, 2008. 2 Mehrotra A, Zaslavsky A & Ayanian, J. Preventive health examinations and preventive gynecological examinations in the United States. Arch Intern Med. 2007;167(17):1876-1883
New England DD Health Facts State Developmental Disability Benchmarks Back to Dental Visits Back to Main Menu State: Connecticut DDS Indicator: Percent of adults with a dental visit within the past six months IMPORTANT NOTE: NCI data is based on a more stringent criteria of dental visits within the past 6 months. This is NOT directly comparable to the general population benchmarks which rely on a criteria of a dental visit within the past year (12 months). REFERENCES: Visit within past 6-mo. Visit within past 12-mo. 1 NCI: New England State Results (2006-2007). Special report prepared by HSRI, September 12, 2008.
New England DD Health Facts State Developmental Disability Benchmarks Back to Dental Visits Back to Main Menu State: Maine - OACPDS Indicator: Percent of adults with a dental visit within the past six months IMPORTANT NOTE: NCI data is based on a more stringent criteria of dental visits within the past 6 months. This is NOT directly comparable to the general population benchmarks which rely on a criteria of a dental visit within the past year (12 months). Visit within past 6-mo. Visit within past 12-mo. REFERENCES: 1 NCI: New England State Results (2006-2007). Special report prepared by HSRI, September 12, 2008.
New England DD Health Facts State Developmental Disability Benchmarks Back to Dental Visits Back to Main Menu State: Rhode Island - DDD Indicator: Percent of adults with a dental visit within the past six months IMPORTANT NOTE: NCI data is based on a more stringent criteria of dental visits within the past 6 months. This is NOT directly comparable to the general population benchmarks which rely on a criteria of a dental visit within the past year (12 months). Visit within past 6-mo. Visit within past 12-mo. REFERENCES: 1 NCI: New England State Results (2006-2007). Special report prepared by HSRI, September 12, 2008.
New England DD Health Facts State Developmental Disability Benchmarks Back to Dental Visits Back to Main Menu State: Vermont - DAIL Indicator: Percent of adults with a dental visit within the past six months IMPORTANT NOTE: NCI data is based on a more stringent criteria of dental visits within the past 6 months. This is NOT directly comparable to the general population benchmarks which rely on a criteria of a dental visit within the past year (12 months). Visit within past 6-mo. Visit within past 12-mo. REFERENCES: 1 NCI: New England State Results (2006-2007). Special report prepared by HSRI, September 12, 2008.
New England DD Health Facts State Developmental Disability Benchmarks Back to Physical Activity Back to Main Menu State: Connecticut - DDS Indicator: Percent of adults who are physically inactive. Note: Lower percentages represent greater levels of physical activity (healthier) REFERENCES: 1 NCI New England State Results (2006-2007). Special report prepared by HSRI, September 12, 2008. 2 CDC. Division of Nutrition, Physical Activity and Obesity, National Center for Chronic Disease Prevention and Health Promotion. U.S. Physical Activity Statistics, March 2008. available at: http://apps.nccd.cdc.gov/PASurveillance/StateSumV.asp
New England DD Health Facts State Developmental Disability Benchmarks Back to Physical Activity Back to Main Menu State: Rhode Island - DDD Indicator: Percent of adults who are physically inactive. Note: Lower percentages represent greater levels of physical activity (healthier) REFERENCES: 1 NCI New England State Results (2006-2007). Special report prepared by HSRI, September 12, 2008. 2 CDC. Division of Nutrition, Physical Activity and Obesity, National Center for Chronic Disease Prevention and Health Promotion. U.S. Physical Activity Statistics, March 2008. available at: http://apps.nccd.cdc.gov/PASurveillance/StateSumV.asp
New England DD Health Facts State Developmental Disability Benchmarks Back to Physical Activity Back to Main Menu State: Vermont- DAIL Indicator: Percent of adults who are physically inactive. Note: Lower percentages represent greater levels of physical activity (healthier) REFERENCES: 1 NCI New England State Results (2006-2007). Special report prepared by HSRI, September 12, 2008. 2 CDC. Division of Nutrition, Physical Activity and Obesity, National Center for Chronic Disease Prevention and Health Promotion. U.S. Physical Activity Statistics, March 2008. available at: http://apps.nccd.cdc.gov/PASurveillance/StateSumV.asp
New England DD Health Facts State Developmental Disability Benchmarks Back to Tobacco Use Back to Main Menu State: Connecticut - DDS Indicator: Percent of adults who smoke/use tobacco. REFERENCES: 1 NCI New England State Results (2006-2007). Special report prepared by HSRI, September 12, 2008. 2 Centers for Disease Control and Prevention (CDC), Behavioral Risk Factor Surveillance System Survey Data (BRFSS), accessed 06/10/2008. Available at http://apps.nccd.cdc.gov/brfss/list.asp?cat=TU&yr=2007&qkey=4396&state=All.
New England DD Health Facts State Developmental Disability Benchmarks Back to Tobacco Use Back to Main Menu State: Rhode Island - DDD Indicator: Percent of adults who smoke/use tobacco. REFERENCES: 1 NCI New England State Results (2006-2007). Special report prepared by HSRI, September 12, 2008. 2 Centers for Disease Control and Prevention (CDC), Behavioral Risk Factor Surveillance System Survey Data (BRFSS), accessed 06/10/2008. Available at http://apps.nccd.cdc.gov/brfss/list.asp?cat=TU&yr=2007&qkey=4396&state=All.
New England DD Health Facts State Developmental Disability Benchmarks Back to Tobacco Use Back to Main Menu State: Vermont- DAIL Indicator: Percent of adults who smoke/use tobacco. REFERENCES: 1 NCI New England State Results (2006-2007). Special report prepared by HSRI, September 12, 2008. 2 Centers for Disease Control and Prevention (CDC), Behavioral Risk Factor Surveillance System Survey Data (BRFSS), accessed 06/10/2008. Available at http://apps.nccd.cdc.gov/brfss/list.asp?cat=TU&yr=2007&qkey=4396&state=All.
New England DD Health Facts State Developmental Disability Benchmarks Back to Weight Back to Main Menu State: Connecticut - DDS Indicator: Percent of adults who are overweight. IMPORTANT NOTE: NCI indicator is not directly comparable to the general population data due to differences in definition and methods for determining weight categories. NCI data may underestimate the prevalence of overweight conditions since it is based on subjective response not BMI. REFERENCES: 1 Data based on self report and from a special report prepared by HSRI: NCI New England State Results (2006-2007), September 12, 2008. 2 Data for overweight AND obese categories combined. From The Centers for Disease Control and Prevention (CDC), Behavioral Risk Factor Surveillance System Survey Data (BRFSS). 3 Data for overweight AND obese categories combined for this table. Analysis from: Yamaki K. Body Weight Status Among Adults With Intellectual Disability in the Community. Mental Retardation: 2005, Vol. 43, No. 1, pp. 1–10. OB– Obese (defined by BMI) OW– Overweight (defined by self report in NCI and BMI in other datasets)
New England DD Health Facts State Developmental Disability Benchmarks Back to Weight Back to Main Menu State: Rhode Island - DDD Indicator: Percent of adults who are overweight. IMPORTANT NOTE: NCI indicator is not directly comparable to the general population data due to differences in definition and methods for determining weight categories. NCI data may underestimate the prevalence of overweight conditions since it is based on subjective response not BMI. REFERENCES: 1 Data based on self report and from a special report prepared by HSRI: NCI New England State Results (2006-2007), September 12, 2008. 2 Data for overweight and obese categories combined. From The Centers for Disease Control and Prevention (CDC), Behavioral Risk Factor Surveillance System Survey Data (BRFSS). 3 Data for overweight and obese categories combined for this table. Analysis from: Yamaki K. Body Weight Status Among Adults With Intellectual Disability in the Community. Mental Retardation: 2005, Vol. 43, No. 1, pp. 1–10. OB– Obese (defined by BMI) OW– Overweight (defined by self report in NCI and BMI in other datasets)
New England DD Health Facts State Developmental Disability Benchmarks Back to Weight Back to Main Menu State: Vermont - DAIL Indicator: Percent of adults who are overweight. IMPORTANT NOTE: NCI indicator is not directly comparable to the general population data due to differences in definition and methods for determining weight categories. NCI data may underestimate the prevalence of overweight conditions since it is based on subjective response not BMI. REFERENCES: 1 Data based on self report and from a special report prepared by HSRI: NCI New England State Results (2006-2007), September 12, 2008. 2 Data for overweight and obese categories combined. From The Centers for Disease Control and Prevention (CDC), Behavioral Risk Factor Surveillance System Survey Data (BRFSS). 3 Data for overweight and obese categories combined for this table. Analysis from: Yamaki K. Body Weight Status Among Adults With Intellectual Disability in the Community. Mental Retardation: 2005, Vol. 43, No. 1, pp. 1–10. OB– Obese (defined by BMI) OW– Overweight (defined by self report in NCI and BMI in other datasets)
New England DD Health Facts State Developmental Disability Benchmarks Back to Mood Disorders Back to Psychotropic Drugs Back to Main Menu State: Connecticut - DDS Indicator: Percent of adults who use psychotropic medications for mood disorders. IMPORTANT NOTE: NCI indicator is not directly comparable to the general population data due to differences in definition. National benchmarks may underestimate the prevalence of medications used to treat all mood disorders. REFERENCES: 1 NCI New England State Results (2006-2007). Special report prepared by HSRI, September 12, 2008. 2 Stagnitti M. Trends in Antidepressant Use by the U.S. Civilian Noninstitutionalized Population, 1997 and 2002. Medical Expenditure Panel Survey: Statistical Brief No. 76. AHRQ, May 2005. Data available at: http://www.meps.ahrq.gov/mepsweb/data_files/publications/st76/stat76.pdf 3 Spreat S & Conroy J. Use of Psychotropic Medications for Persons With Mental Retardation Who Live in Oklahoma Nursing Homes. Psychiatr Serv 49:510-512, April 1998. Available at: http://psychservices.psychiatryonline.org/cgi/content/full/49/4/510
New England DD Health Facts State Developmental Disability Benchmarks Back to Mood Disorders Back to Psychotropic Drugs Back to Main Menu State: Rhode Island - DDD Indicator: Percent of adults who use psychotropic medications for mood disorders. IMPORTANT NOTE: NCI indicator is not directly comparable to the general population data due to differences in definition. National benchmarks may underestimate the prevalence of medications used to treat all mood disorders. REFERENCES: 1 NCI New England State Results (2006-2007). Special report prepared by HSRI, September 12, 2008. 2 Stagnitti M. Trends in Antidepressant Use by the U.S. Civilian Noninstitutionalized Population, 1997 and 2002. Medical Expenditure Panel Survey: Statistical Brief No. 76. AHRQ, May 2005. Data available at: http://www.meps.ahrq.gov/mepsweb/data_files/publications/st76/stat76.pdf 3 Spreat S & Conroy J. Use of Psychotropic Medications for Persons With Mental Retardation Who Live in Oklahoma Nursing Homes. Psychiatr Serv 49:510-512, April 1998. Available at: http://psychservices.psychiatryonline.org/cgi/content/full/49/4/510
New England DD Health Facts State Developmental Disability Benchmarks Back to Anxiety Back to Psychotropic Drugs Back to Main Menu State: Connecticut - DDS Indicator: Percent of adults who use psychotropic medications for anxiety. IMPORTANT NOTE: NCI indicator is not directly comparable to the general population data due to differences in definition. National benchmark may underestimate the prevalence of medications used to treat all forms of anxiety. REFERENCES: 1 NCI New England State Results (2006-2007). Special report prepared by HSRI, September 12, 2008. 2 Spreat S & Conroy J. Use of Psychotropic Medications for Persons With Mental Retardation Who Live in Oklahoma Nursing Homes. Psychiatr Serv 49:510-512, April 1998. Available at: http://psychservices.psychiatryonline.org/cgi/content/full/49/4/510
New England DD Health Facts State Developmental Disability Benchmarks Back to Anxiety Back to Psychotropic Drugs Back to Main Menu State: Rhode Island - DDD Indicator: Percent of adults who use psychotropic medications for anxiety. IMPORTANT NOTE: NCI indicator is not directly comparable to the general population data due to differences in definition. National benchmark may underestimate the prevalence of medications used to treat all forms of anxiety. REFERENCES: 1 NCI New England State Results (2006-2007). Special report prepared by HSRI, September 12, 2008. 2 Spreat S & Conroy J. Use of Psychotropic Medications for Persons With Mental Retardation Who Live in Oklahoma Nursing Homes. Psychiatr Serv 49:510-512, April 1998. Available at: http://psychservices.psychiatryonline.org/cgi/content/full/49/4/510
New England DD Health Facts State Developmental Disability Benchmarks Back to Behavior Problems Back to Psychotropic Drugs Back to Main Menu State: Connecticut - DDS Indicator: Percent of adults who use psychotropic medications for behavior problems. IMPORTANT NOTE: NCI indicator is not directly comparable to available general population benchmarks. REFERENCES: 1 NCI New England State Results (2006-2007). Special report prepared by HSRI, September 12, 2008.
New England DD Health Facts State Developmental Disability Benchmarks Back to Behavior Problems Back to Psychotropic Drugs Back to Main Menu State: Rhode Island - DDD Indicator: Percent of adults who use psychotropic medications for behavior problems. IMPORTANT NOTE: NCI indicator is not directly comparable to available general population benchmarks. REFERENCES: 1 NCI New England State Results (2006-2007). Special report prepared by HSRI, September 12, 2008.
New England DD Health Facts State Developmental Disability Benchmarks Back to Psychotic Disorders Back to Psychotropic Drugs Back to Main Menu State: Connecticut - DDS Indicator: Percent of adults who use psychotropic medications for psychotic disorders. REFERENCES: 1 NCI New England State Results (2006-2007). Special report prepared by HSRI, September 12, 2008. 2 Spreat S & Conroy J. Use of Psychotropic Medications for Persons With Mental Retardation Who Live in Oklahoma Nursing Homes. Psychiatr Serv 49:510-512, April 1998. Available at: http://psychservices.psychiatryonline.org/cgi/content/full/49/4/510
New England DD Health Facts State Developmental Disability Benchmarks Back to Psychotic Disorders Back to Psychotropic Drugs Back to Main Menu State: Rhode Island - DDD Indicator: Percent of adults who use psychotropic medications for psychotic disorders. REFERENCES: 1 NCI New England State Results (2006-2007). Special report prepared by HSRI, September 12, 2008. 2 Spreat S & Conroy J. Use of Psychotropic Medications for Persons With Mental Retardation Who Live in Oklahoma Nursing Homes. Psychiatr Serv 49:510-512, April 1998. Available at: http://psychservices.psychiatryonline.org/cgi/content/full/49/4/510