Download
1 / 10
100 likes | 311 Views
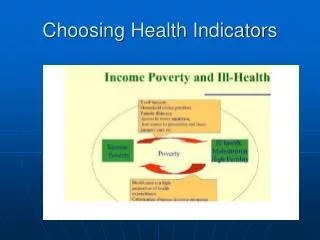
Choosing Health Indicators. Health, Income and Poverty. 70% of the variance in infant mortality can be attributed to across and within country differences in income; Half of the burden of communicable diseases is concentrated in the Lowest income quintile (poorest 20%);

E N D
Health, Income and Poverty • 70% of the variance in infant mortality can be attributed to across and within country differences in income; • Half of the burden of communicable diseases is concentrated in the • Lowest income quintile (poorest 20%); • Globally the poorest 20% experience three and a half the mortality and four times the number of Disability Adjusted Life-Years (DALYs) loss of the richest 20%, an equivalent to excess mortality of nearly 10,000, 000 deaths per year; • Communicable diseases are responsible for 60% of both deaths and DALYs’ loss in the poorest groups.
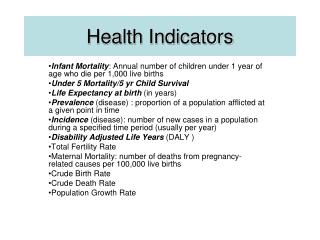
Key Performance Indicators • Structural- buildings, equipment, supplies, vehicles • Process- prevention, diagnosis, numbers trained, • Outcome- five “D’s”- death, diseases, disability, dissatisfaction, discomfort
Structural Indicators • Household characteristics – household size, number of rooms • Pharmacy supplies of specific categories of drugs, e.g., anti-malarials • Numbers of latrines, • Number of stem pipes, boreholes
Process Indicators • Changes in access times for secure water supplies • Access to maternal medical services such as trained birth attendants, and number of pre-delivery visits • In migration patterns – place of origin of household members, professional status of household members • Training with follow-up knowledge attitudes practices beliefs (KABP) around prevailing diseases
Outcome Indicators • Disease specific prevalence rates • Anemia prevalence • Anthropometric measurements of young children • Alcohol use, smoking rates, domestic violence and accidents • Toxicology – biomonitoring (lead, arsenic, etc.) if relevant • Increase in prevalent disease • Appearance of new disease
Key Performance Indicators (KPIs) KPIs • Typically track changes in the level of a variable over time, i.e., “rates” • Objectively demonstrating rate changes, positive or negative, is surprisingly complex • Small community population sizes can mean big statistical analysis problems, e.g., infant and maternal mortality • Underlying community disease rates naturally fluctuate over time and space, e.g., malaria • For high profile complex projects a formal Demographic Surveillance System (DSS) is a cost-effective, capacity building and sustainable strategy