Download
1 / 35
350 likes | 589 Views
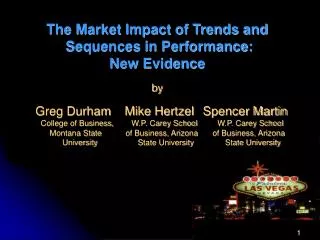
The Market Impact of Trends and Sequences in Performance: New Evidence by Greg Durham Mike Hertzel Spencer Martin College of Business, W.P. Carey School W.P. Carey School Montana State of Business, Arizona of Business, Arizona University State University State University.

E N D
The Market Impact of Trends and Sequences in Performance: New Evidence by Greg Durham Mike Hertzel Spencer Martin College of Business, W.P. Carey School W.P. Carey School Montana State of Business, Arizona of Business, Arizona University State University State University
The Market Impact of Trends and Sequences in Performance: New Evidence FROM THE COLLEGE FOOTBALL WAGERING MARKET by Greg Durham Mike Hertzel Spencer Martin College of Business, W.P. Carey School W.P. Carey School Montana State of Business, Arizona of Business, Arizona University State University State University
Empirical Pricing Anomalies • Momentum over Shorter Horizons • Indexes: Butler, Poterba, & Sum- mers (1991) • Stocks: Jegadeesh & Titman (1993), and others • Reversals over Longer Horizons • DeBondt & Thaler (1985), • and others
Behavioral Models • Daniel, Hirshleifer, & Subrahmanyam (1998) • — Self-Attribution Bias and Overconfidence • Hong & Stein (1999) • — Bounded Rationality • … of particular interest to this study is: • Barberis, Shleifer & Vishny (1998) • — Conservatism Bias • — Reliance on the Represen- tativeness Heuristic
BSV’s Regime-Shifting Model • Conservatism Bias (Edwards, 1968) • Underestimation of the value of new information • Over-reliance on older information • Representativeness Bias (Tversky & Kahneman, 1974) • Over-reliance on similarities to the parent pop- • ulation and on the salient features • of an event • Insufficient regard to other • important factors
BSV’s Regime-Shifting Model • In actuality, a firm’s earnings performance fol- lows a random walk ... yet, investors believe that performance switches between: • Continuation (or Trending) Regime • performance tends to be followed by like performance • Reversal Regime • performance tends to reverse; • i.e., returns are mean-reverting
Testable Implications • The nature of the relation between prior performance and current prices turns out to be a key testable implication of the model developed by BSV • Performance follows a random walk • In formulating beliefs, investors examine past perfor- mance
Sports Betting Markets • Bettors have real wealth at stake • Numerous parallels to securities markets: • Informed bettors “Experts” • Sentiment bettors Market makers • Point spreads are used to balance books • A sports bet has an obvious “settling up” point, at which terminal payoffs are unambig- uously realized
College Football Wagering Dataset • 8 seasons of games from Division I-A, 1991-98 • For each game: • Opening Spread Change in Spread • Closing Spread Actual Outcome • Purchased from ComputerSportsWorld • Spreads posted by Las Vegas’ StardustCasino’s Sports Book
Point-Spread Market Mechanics • Games almost always occur on Saturdays • Betting begins Sunday night prior • Odds and cash flows are fixed, so market makers quote point spreads • Investors pay $11 to win $21 or $0 • For each pair of $11 bets on each team, $21 is paid transax’n costs = 4.54% • Spreads fluctuate during week, but the expected change, in an efficient market, is zero
Sun. Mechanics Demonstrated • Spreads fluctuate during week in response to an imbalance of orders (wagers) on one team MSU v. UofM MSU 5 kickoff
Mechanics Demonstrated • Spreads fluctuate during week in response to an imbalance of orders (wagers) on one team MSU v. UofM MSU 5 MSU 5 Sun. kickoff
Mechanics Demonstrated • Spreads fluctuate during week in response to an imbalance of orders (wagers) on one team MSU v. UofM MSU wins by >5!! MSU 5 MSU 5 Sun. kickoff
Mechanics Demonstrated • Spreads fluctuate during week in response to an imbalance of orders (wagers) on one team MSU v. UofM MSU 5 MSU 5 MSU wins by <5 or loses outright!! Sun. kickoff
Mechanics Demonstrated • Spreads fluctuate during week in response to an imbalance of orders (wagers) on one team MSU v. UofM MSU 5 MSU 5 MSU wins by 5!! Sun. kickoff
Mechanics Demonstrated • Spreads fluctuate during week in response to an imbalance of orders (wagers) on one team MSU v. UofM MSU 5 Good NEWS for MSU!! Sun. kickoff
Mechanics Demonstrated • Spreads fluctuate during week in response to an imbalance of orders (wagers) on one team MSU v. UofM MSU 6.5 MSU 5 Good NEWS for MSU!! Sun. kickoff
Now, the Tests … • Testable implications of the BSV model: • Performance follows a random walk • In formulating beliefs, investors examine past perfor- mance
Does Performance Follow Random Walk? • Sorting Observations by Streak Length Suggests “Yes” (Table I) • Observations per bin fall by ≈50% with each successive increment in streak length • Team-by-Team Runs Tests Suggest “Yes” (Table II) • For 105 of 113 teams, num- ber of runs is normal
Does Performance Follow Random Walk? • Sorting Observations by Streak Length Suggests “Yes” (Table I) • Observations per bin fall by ≈50% with each successive increment in streak length • Team-by-Team Runs Tests Suggest “Yes” (Table II) • For 105 of 113 teams, num- ber of runs is normal
Do Investors Use Recent Freq’s of Reversals? • Identified teams with same 16 patterns as used by Bloomfield and Hales (JFE, 2002) (Table III) • Spread is insignificant for all groups • Mean changes are not different across low-, medium-, & high-reversal groups • Findings are inconsistent with the experimental subject results • Findings are inconsistent with predictions of the BSV Model
Do Investors Use Recent Freq’s of Reversals? A E B F G C H D
Do Investors Use Recent Freq’s of Reversals? • Identified teams with same 16 patterns as used by Bloomfield and Hales (JFE, 2002) (Table III) • Spread is insignificant for all groups • Mean changes are not different across low-, medium-, & high-reversal groups • Findings are inconsistent with the experimental subject results • Findings are inconsistent with predictions of the BSV Model
Do Investors Use Recent Freq’s of Reversals? • Sorted observations according to the 256 possible 8-game historical patterns (Table IV) • Spread is insignificant for all groups • Mean changes are not different across low-, medium-, and high-reversal groups • Football market participants appear completely insensitive to the number of re- • cent reversals in performance • Findings are inconsistent • with BSV’s predictions
Do Investors Use Longer Histories? • Expanded histories to include 16- and 30-game historical patterns (Table V) • 8- and 16-game: Mean changes are not dif- ferent across low- and high-reversal groups • 30-game: Mean changes ARE stat.-signif. different across low- and high-reversal groups • Findings for 30-game histories • are weakly consistent with • BSV’s predictions
Do Investors Use Streak Lengths? • Streak-Based Tests (Table VI) • Piece-wise regression analysis: • Spread = α + βHW1HWStrk1 + βHW2HWStrk2 • + βAW1AWStrk1 + βAW2AWStrk2 • + βOpenOpen + ε, where • HWStrk1 = home’s W strk. if home’s W strk. < 3 • = 3 if home’s W strk. ≥ 3 • HWStrk2 = 0 if home’s W strk. < 3 • = home’s W strk. – 3 if • home’s W strk. ≥ 3
HWS2 HWS1 Change in Spread 3 3 3 HLS1 Home Team’s Streak Length HLS2 3 Spline Transformation of Streak Length
Do Investors Use Streak Lengths? • Streak-Based Tests (cont’d) • … and AWStrk1 & AWStrk2 defined similarly • Null hypothesis: βi = 0 for all i • Alternative hypothesis: βi > 0 for i = HW1, HW2, HL1, HL2 and βi < 0 for i = AW1, AW2 , AL1, AL2
Do Investors Use Streak Lengths? • Alternative hypothesis (predicted by BSV): βi > 0 for i = HW1, HW2, HL1, HL2; βi < 0 for i = AW1, AW2, AL1, AL2 • Results: βHW1>0, βHW2<0, βLW1>0, βLW2<0 … all stat.-sig. • Interpretation: Bettors expect short streaks to continue & longer streaks to reverse • Similar results based on losing streaks
0.131 –0.091 3 3 Home Team’s Streak Length Spline Transformation of Streak Length HLS2 Change in Spread 0.363 HWS1 –0.115 0.188 HWS2 HLS1 0.574
Do Investors Use Streak Lengths? • Alternative hypothesis (predicted by BSV): βi > 0 for i = HW1, HW2; βi < 0 for i = AW1, AW2 • Results: βHW1>0, βHW2<0, βLW1>0, βLW2<0 … all stat.-sig. • Interpretation: Bettors expect short streaks to continue & longer streaks to reverse • Similar results based on losing streaks
CONCLUSIONS • Performance (against point spreads) is random • Consistent with Assumption of BSV Model • Football bettors are relatively insensitive to the frequency of recent performance reversals • Inconsistent w/ Primary Premise of BSV Model • Bettors expect: ― continuations in short-run performance ― reversal in performance as streak length grows (or exceeds 3) • Consistent w/ Belief in Regimes, but not as hypothesized by BSV
CONTACT INFORMATION • GREG DURHAM • Assistant Professor of Finance • Montana State University • Phone: (406) 994-6201 • E-mail: gregdurham@montana.edu