Download

1 / 5
0 likes | 9 Views
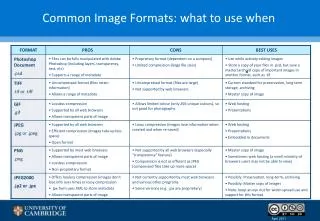
Graphical reports utilize charts, graphs, and diagrams to visually represent data and findings. This format is useful for highlighting key trends, patterns, and relationships in the data, making it easier for readers to interpret complex information.

E N D