Download
1 / 9
90 likes | 101 Views
Cognitive tests are administered by mental health researchers and practitioners. Different cognitive domains, such as Attention, Executive Function, Psychomotor Speed, Memory, and Emotional & Social Cognition, are assessed using cognitive tests. Using mobile technology to collect data from cognitive tests is an efficient way to generate such reports.<br><br>To know more visit:- https://www.playpowerlabs.com/

E N D
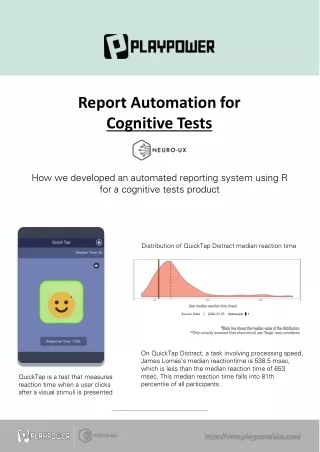
Report Automation for Cognitive Tests How we developed an automated reporting system using R for a cognitive tests product Distribution of QuickTap Distract median reaction time On QuickTap Distract, a task involving processing speed, James Lomas’s median reactiontime is 538.5 msec, which is less than the median reaction time of 653 msec. This median reaction time falls into 81th percentile of all participants. QuickTap is a test that measures reaction time when a user clicks after a visual stimuli is presented
Mental health researchers and practitioners administer cognitive tests to understand the mental capabilities of people. Cognitive tests assess different cognitive domains such as Attention, Executive Function, Psychomotor Speed, Memory, and Emotional & Social Cognition. Some applications of cognitive tests include: Understand how external factors affect a person’s cognitive ability Determine within reason if a person has any mental impairments Assessing a candidate’s cognitive ability during the hiring process Measure traits that are related to mathematics learning A cognitive test report for a participant helps us gain essential insights into their cognition. The report can act as a tool to inform necessary actions. Data collection of cognitive tests through mobile technologies provides an efficient way to generate such reports. We had the opportunity to work with one such product’s data. The goal was to prepare a real-time automated reporting system. A researcher could generate reports for the participants part of the research study to compare their performance.
High-quality data is an essential prerequisite to performing any data analysis to gain insights. We performed different data quality checks to ensure the data validation for the required data analysis. Accuracy: The data should reflect real-world scenarios. We used the product and analyzed the log data for our interactions with the product. Completeness: The data should contain all the required values. We checked if there were any null values in the data. Validity: The data should follow some rules, and the values should be within specified ranges. We collaborated with the product team to validate the data. Uniqueness: There should be no duplicate records or columns in the data. We removed multiple columns that had redundant information. Timeliness: The data should be available when required. The product team ensured that data was available in real-time. Consistency: The data should be consistent across product versions. We cleaned the data from old versions of the product.
While performing the data quality checks, we also came across some challenges. Multiple teams developed the cognitive tests at different times. There was no standard data format or data logging guideline in place. We faced issues like redundant variables, various metrics for the same variable, values out of range, incomplete data, etc. We collaborated with the product team to prepare a data dictionary for the existing data based on the data profiling. We designed a data guideline by eliminating redundant variables, specifying ranges and data format for each variable. We asked the product team to use the data logging guideline to make the required changes to log data. Meanwhile, we cleaned the old data and ensured it was consistent with the latest version.
After validating the data, we performed Exploratory Data Analysis (EDA) for each cognitive test. We discovered patterns and tested our hypotheses by using summary statistics and visualizations. We then collaborated with the product designers to create metrics and visualizations for the report. Here are a few metrics that we reported on: Error Rate: Percentage of attempts with the incorrect answer. It was an essential metric in tests involving inhibitory control- the ability to resist interference from distracting stimuli. Reaction Time: Time taken to complete a task. We used this metric in tests involving psychomotor speed- the ability to detect and respond to rapid changes. Percentage Score: Percentage of attempts with the correct answer. We used this metric in tests involving inhibitory control, working memory, and social cognition. Percentile Score: We also had the percentile score for each metric to know the participant’s placement in the distribution.
For each cognitive test, we prepared a visualization showing the distribution of scores for all users and highlighted the median score by a dashed line and the user’s score with a thick brown colored line. We summarized the user’s performance on each task with a text describing their score, the median score, and where they lie in the distribution using percentile score. On QuickTap Distract, a task involving processing speed, James Lomas’s median reactiontime is 538.5 msec, which is less than the median reaction time of 653 msec. This median reaction time falls into 81th percentile of all participants. QuickTapis a test that measures reaction time when a user clicks after a visual stimuli is presented On Copy Kat, a task involving working memory, James Lomas received a score of 10, which is more than the median score of 8. This score falls into the 66th percentile of all participants CopyKat is a test that involves working memory. The user is shown a sequence of colored tiles, and thenthe user is asked to copy the sequence.
On Color Trick, a task involving inhibition control, James Lomas received a score of 86.7%, which is less than the median score of 90%. This score falls into the 49th percentile of all participants. Color Trick is a test that involves inhibitition control. The user asked to match the color of the word with it’s meaning Memory game is a test that involves working memory. The user is shown a screen to memorize and then asked a question On Memory Game, a task involving working memory, James Lomas received a score of 85.7%, which is more than the median score of 85%. This score falls into the 50th percentile of all participants.
Once we finalized the metrics, visualizations, and report format, we built an API using Plumber (an R Package) to get details about the user. To prepare data for the report, we wrote an R script to fetch data for the user and transform it for the next step. We used R Markdown and created child R Markdown scripts for each cognitive test and a master R Markdown script to combine multiple child R Markdown scripts. Based on the user’s tests, the master R Markdown would call different child R Markdown and connect them to generate the final report in PDF format. We then packaged it in a docker container to be deployed.
We developed an automated reporting system using R and integrated it into the product. We did a pilot with a doctor, got positive feedback, and then rolled it to other clients. Their reports helped them understand their patient’s cognitive abilities and track their progress over sessions. By the end of the project, we validated the data and provided a data logging guideline to the product team and a data dictionary for future reference