Download
1 / 18
180 likes | 327 Views
What about Belinda? Or…. How Developmental Scale Scores Came to Be!. A Por Quoi Tale. Written and Illustrated by Miss Multiple.

E N D
What about Belinda? Or…. How Developmental Scale Scores Came to Be! A Por Quoi Tale Written and Illustrated by Miss Multiple
Once upon a time, there was a young teacher named Miss Multiple. Miss Multiple had analyzed her FCAT scores and found out whether Billy, Bobby and Betty had made learning gains. When she got to Belinda, the criteria she was using didn’t work. “What about Belinda?!” Miss Multiple cried. Yes, went up a level No, went down a level Yes, maintained. Can’t tell using 1 & 2!
“What about Belinda?” thought Miss Multiple,” She achieved a level 1 in 3rd grade, and remained at a level 1 in 4th grade. Hmmmm… I KNOW she’s made great progress, but how can I prove it when Belinda hasn’t even moved up to a level 2?” To solve this problem, a new way of looking at progress on the FCAT SSS tests needed to be developed. “I need a way to show that the FCAT SSS tests require more from grade to grade, and a way to show, for example, that a level 1 in grade 3 may not be exactly the same as a level 1 in grade 4,” thought Miss Multiple.
With these thoughts in mind, Miss Multiple decided to drop in for a quick visit with her brother who happened to be head of the math department at Show Me Don’t Tell Me University. Miss Multiple quickly explained her frustrations with the learning gains analysis she had done. Her brother, Howard, listened with interest, and started scribbling score scales on his living room whiteboard . “That’s an intriguing problem, Marcie,” he said, “I’ll get right on it.”
“Brrrring,” sang Miss Multiple’s phone. “It’s thuh middle uh the night,” she muttered, fumbling for the receiver, “It must be Howard.” It was. 20 minutes later, armed with a large cup of coffee, Miss Multiple was knocking on her brother’s door still muttering under her breath. “This had better be good, Howard,” she grumbled, “It’s three in the morning.” “It is good,” Howard beamed, “I’ve invented Developmental Scale Scores.”
Miss Multiple was very pleased. “Good job,” she yawned, “Err…how exactly does it work?” Howard cleared his throat, “Well, first I created a scale from 0-3000”, he began, “I figured that would be big enough to fit all the grade level scores on!”
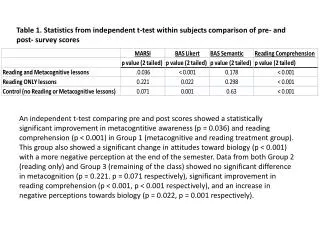
“Next,” he went on enthusiastically, “I looked at the scale scores that make up the levels of the FCAT SSS for each grade from 3-10. Here’s an example showing levels 1-5 for grades 3 & 4 in Reading:” “After this, I looked at the cut points between levels. For example, 258 is the cut point that divides level 1 from level 2 in 3rd grade, and so on...”
Grade Measure Level 1-2 Cut Level 2-3 Cut Level 3-4 Cut Level 4-5 Cut 3 FCAT scale score 258 283 331 393 Developmental score 1045 1197 1488 1865 4 FCAT scale score 274 298 338 385 Developmental Score 1314 1455 1689 1964 3 – 4 Difference 269 258 201 99 “Next, came the really exciting part. I converted the cut points between grade levels to developmental scale scores, and put them in a chart like this: ” “Okay,” said Miss Multiple in a dubious tone of voice, “I can SEE that, but where does the year’s growth thing come in? I just see a bunch of numbers in a chart.”
Grade Measure Level 1-2 Cut Level 2-3 Cut Level 3-4 Level 4-5 3 FCAT scale score 258 283 331 393 3 Developmental score 1045 1197 1488 1865 4 FCAT scale score 274 298 338 385 4 Developmental Score 1314 1455 1689 1964 3 – 4 Difference 269 258 201 99 “This is where it really gets fun,” said Howard excitedly, “Now, we subtract the developmental scale score cut points for 3rd grade from the cut points for 4th grade and write down the differences.” “See, like this!” he said, scribbling on his white board. 1314 - 1045 = 269
“Oh, joy,” said Miss Multiple, who knew how her brother was when he got on a roll. Howard ignored her, and continued, “Next, we find the median of the differences. We lay out the differences from least to greatest. + 99 201 258 269 Since there is no number exactly in the middle, we add the 2 middle numbers, and divide the answer by 2. This gives us 230 points.” So… 230 points is the average learning gain expected in reading from grade 3 to 4!”
“And you did this for grades 3-10?” asked Miss Multiple. “Yep,” said Howard proudly. “And I made a chart showing that, too!”
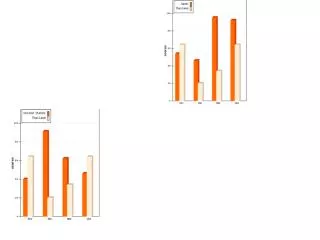
Have you tried it with Belinda’s scores?” Miss Multiple asked. “Of course,” beamed Howard, “Just look!” He fumbled on his desk and brought out her score sheets to which he had added the Developmental Scale Scores for each student. “Belinda went up 347 points. The expected learning gain in math from grade 3 to 4 is only 162 points!” Yes,up a level No, down a level Yes, maintained. Yes,>162 DSS diff
“Let’s take a closer look,” Howard continued, “Here’s how the whole developmental scale looks with the 3rd-5th grade FCAT SSS scales for math laid out on it.”
“Billy started with a score of 1184 in 3rd grade. This was a level 2 on the FCAT SSS Math Test. He moved up 346 points on the DSS and attained a level 3 on the 4th grade test!” He made a year’s learning gain by going up a level. *Expected learning gain in math from 3rd to 4th grade is 162 points on the DSS.
“Betty started with a score of 1522 in 3rd grade. This was a level 4 on the FCAT SSS Math test. She moved up 100 points on the DSS and went down to a level 3 on the 4th grade test! She did not make a year’s learning gains because she went down a level on the FCAT SSS test. *Expected learning gain in math from 3rd to 4th grade is 162 points on the DSS.
“Bobby started with a score of 1277 in 3rd grade. This was a level 3 on the FCAT SSS Math Test. He moved up 314 points and attained a level 3 on the 4th grade test! He made learning gains by maintaining a level 3.” *Expected learning gain in math from 3rd to 4th grade is 162 points on the DSS.
“Belinda started with a score of 916 in 3rd grade. This was a level 1 on the FCAT SSS Math Test. She moved up 347 points even though she still scored in a level 1 on the 4th grade test! She made learning gains by exceeding the expected 162 points on the DSS scale.” *Expected learning gain in math from 3rd to 4th grade is 162 points on the DSS.
Miss Multiple was a very happy teacher , because now she could show the learning gains each of her students had made for the year; including the children who continued to score in levels 1 and 2 on the FCAT SSS tests! And they ALL lived “HOPPILY” ever after!