Download
1 / 5
60 likes | 265 Views
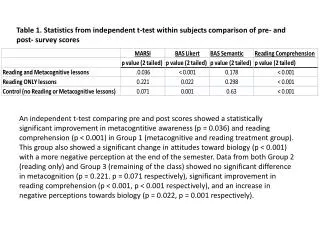
Table 1. Statistics from independent t-test within subjects comparison of pre- and post- survey scores.

E N D
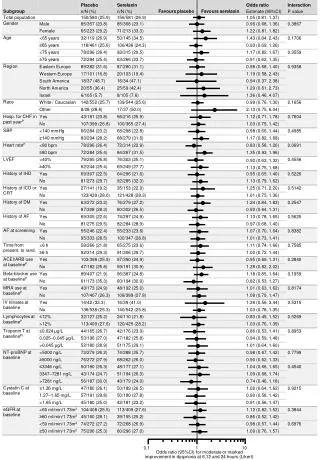
Table 1. Statistics from independent t-test within subjects comparison of pre- and post- survey scores An independent t-test comparing pre and post scores showed a statistically significant improvement in metacogntitive awareness (p = 0.036) and reading comprehension (p < 0.001) in Group 1 (metacognitive and reading treatment group). This group also showed a significant change in attitudes toward biology (p < 0.001) with a more negative perception at the end of the semester. Data from both Group 2 (reading only) and Group 3 (remaining of the class) showed no significant difference in metacognition (p = 0.221. p = 0.071 respectively), significant improvement in reading comprehension (p < 0.001, p < 0.001 respectively), and an increase in negative perceptions towards biology (p = 0.022, p = 0.001 respectively).
Figure 1. Pre and post-survey results for metacognitive awareness in reading skills inventory (MARSI) . Students were given the MARSI survey at the start of the semester before any treatment was performed (pre). Treatment was administered throughout the semester and gains in metacognitive awareness in reading skills was assessed at the end of the semester (post). The reading and metacognitive group had a n = 53 (pre and post), reading only n= 28 (pre and post), and the control group n= 138 pre, and 158 post. The overall analysis within subjects shows the reading and metacognitive group had significant gains in MARSI scores (p < 0.05) .
Figure 2. Pre and post-survey results for Biology Attitude Scale Likert scores (BAS Likert) . Students were given the BAS survey at the start of the semester before any treatment was performed (pre). Treatment was administered throughout the semester and changes in attitudes towards biology was assessed at the end of the semester (post) using both a likert and semantic scale. The reading and metacognitive group had a n = 53 (pre and post), reading only n= 28 (pre and post), and the control group n= 138 pre, and 158 post. Attitudes in all three groups decreased with significance (p < 0.05) in all groups for the likert scale, but not in a statistically significant matter using the semantic scale.
Figure 3. Pre and post-survey results for Reading comprehension scores. As part of the pre- and post-survey, students were given reading passages and asked comprehension questions. Treatment was administered throughout the semester and changes in reading comprehension were assessed at the end of the semester (post). The reading and metacognitive group had a n = 53 (pre and post), reading only n= 28 (pre and post), and the control group n= 138 pre, and 158 post. Reading comprehension increased in all three groups regardless o the treatment type (p < 0.05) .
Still to come… • Standard deviation bars to be added to graphs • Data comparing results between the three treatment groups