Download
1 / 51
530 likes | 884 Views
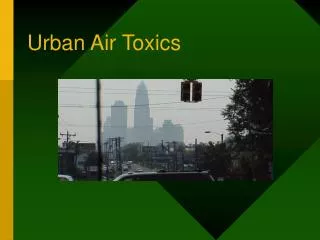
Urban Air Toxics. The UAT Monitoring Network. Winston Salem. Research Triangle Park. Asheville. Raleigh. Candor. Charlotte. Wilmington. Urban Sites Asheville Charlotte Winston-Salem Raleigh Research Triangle Park Wilmington. Rural Site Candor.

E N D
The UAT Monitoring Network Winston Salem Research Triangle Park Asheville Raleigh Candor Charlotte Wilmington Urban Sites Asheville Charlotte Winston-Salem Raleigh Research Triangle Park Wilmington Rural Site Candor
Monitoring Site Information The Following Sites are Operated by: The Asheville Site: The Western NC Regional Air Quality Agency The Charlotte Site: The Mecklenburg County, Land Use and Environmental Services Agency The Winston-Salem Site: The Forsyth County Environmental Affairs Department
EPA Toxic Organic (TO) Methods Volatile Organic Compounds (VOCs) EPA Method TO-15 (69 Analytes) • Sample collected into pressurized SUMMA canister • GC/MS with cryogenic preconcentration Carbonyls (aldehydes/ketones) EPA Method TO-11a (12 Analytes) • Sample collected on a DNPH coated silica cartridge • HPLC/UV of DNPH Derivatives Semi Volatile Organic Compounds (SVOCs) EPA Method TO-13a (33 Analytes) • Sample collected on a polyurethane foam cartridge • GC/MS of concentrated extract DNPH = Dinitrophenylhydrozene
Limits of Detection VOCs TO-15 Lower Quantitation Level = 0.2 ppb Method Detection Level = 0.1 ppb Carbonyls TO-11a Method Detection Levels: Formaldehyde/Acetaldehyde = 10 ppt Other aldehyde/ketones = 5 ppt SVOCs TO-13a Lower Quantitation Level = 10 pg/m3 Method Detection Level = 20 pg/m3
Hydrocarbons Hydrocarbons are derived mostly from petroleum sources and are the major components of fossil fuels, and petroleum products as well as plastics, waxes and oils. In urban environments, hydrocarbons (along with nitrogen oxides (NOx) and sunlight) contribute to ozone production. Benzene 1,3-Butadiene Toluene Ethylbenzene Styrene Xylenes
Halogenated VOCs Volatile organic compounds that contain halogens such as chlorine, bromine, fluorine. • Industrial solvent. • Persistent in the atmosphere. • Resist photochemical breakdown. • Chronic health effects. • Contribute to ozone formation. Carbon Tetrachloride Tetrachloroethylene Vinyl Chloride Freons
Polar Compounds Polar compounds are oxygenated compounds such as ethers, ketones, and alcohols. Many of these compounds are used as gasoline additives so that emissions may be characteristic of those from mobile sources. MEK Ethanol MTBE MIBK
Carbonyl Compounds Organic compounds composed of carbon, hydrogen, and oxygen and at least one carbon-oxygen double bond. Factors that effect may airborne concentrations: • Combustion sources, motor vehicles, industrial processes and some natural sources that emit compounds directly into the air. • Photochemical reactions that form carbonyl compounds in the air, typically from airborne hydrocarbons. • Photochemical reactions that consume carbonyls from the air, generally by photolysis or by reaction with hydroxyl radicals. Formaldehyde Acetaldehyde
Semivolatiles (SVOC) Semivolatile: A substance that evaporates slowly at standard temperature and pressure (20°C & 1 atm). Polynuclear Aromatic Hydrocarbons (PAHs) Polychlorinated Biphenyls (PCBs) Polychlorinated Pesticides
HAPs, TAPs, and Core Compounds • HAP: Hazardous Air Pollutant (EPA) • TAP: Toxic Air Pollutant (NCDAQ) • Core Compound: A HAP or TAP that presents a high health risk due to long term exposure (i.e. 70 years) in an urban environment. Typically a carcinogen or chronic toxicant.
Risk Assessment URE: The Unit Risk Estimate is the upper-bound excess lifetime cancer risk estimated to result from continuous exposure to an agent at a concentration of 1 µg/m3 in air. RfC: Reference Concentration (non-cancer) is an estimate of a concentration in air to which a human population might be exposed that is likely to be without appreciable risks of deleterious effects during a lifetime (assumed to be 70 years). Source: EPA
UAT Core Compoundswith detectable results Acetaldehyde Benzene 1,3-Butadiene Carbon Tetrachloride Formaldehyde Methylene Chloride Trichloroethylene
UAT Core Compoundsthat were not detected Chloroform 1,3-Dichloropropene (cis & trans) Ethylene Dibromide Ethylene Dichloride Propylene Dichloride Tetrachloroethylene 1,1,2,2-Tetrachloroethane Vinyl Chloride
HAPs and TAPswith detectable results Propionaldehyde Styrene Toluene Xylenes Benzyl Chloride Carbon Disulfide Ethyl Acetate Ethylbenzene Freons 11, 12, & 113 Hexane
HAPs and TAPsthat were not detected Bromoform Chlorobenzene p-Dichlorobenzene Ethlylidene Chloride Methyl Bromide Methyl Chloroform MIBK MTBE Vinylidene Chloride Vinyl Acetate Vinyl Trichloride
Other Compounds of Interestwith detectable results Acetone Benzaldehyde Butyraldehyde Cyclohexane Ethanol p-Ethyltoluene Heptane Isopropanol Methyl Ethyl Ketone
Other Compounds of Interestthat were not detected Crotonaldehyde Cyclohexane Dibromochloromethane Dichloroethenes (cis & trans) Dichlorobenzenes 2,5-Dimethylbenzaldehyde Freon 114 Hexaldehyde Isovaleraldehyde Methyl Butyl Ketone Valeraldehyde Tetrahydrofuran Tolualdehydes
Benzene: 3-Month Averages 1.0 0.8 0.6 0.4 0.2 MDL URE 0.0 7/1/03 10/1/03 1/1/04 4/1/04 7/1/04 10/1/04 1/1/05 4/1/05 7/1/05 10/1/05 Asheville Garinger Winston Salem RTP Millbrook Wilmington Candor 15 Point Rolling Averages
Toluene: Raw Data 3.5 3.0 2.5 2.0 1.5 1.0 0.5 0.0 7/1/03 10/1/03 1/1/04 4/1/04 7/1/04 10/1/04 1/1/05 4/1/05 7/1/05 10/1/05 Asheville Garinger Winston Salem RTP Millbrook Wilmington Candor
Toluene: 3-Month Averages 1.4 1.2 1.0 0.8 0.6 0.4 0.2 MDL 0.0 7/1/2003 10/1/2003 1/1/2004 4/1/2004 7/1/2004 10/1/2004 1/1/2005 4/1/2005 7/1/2005 10/1/2005 Asheville Garinger Winston Salem RTP Millbrook Wilmington Candor 15 Point Rolling Average
Hexane: 3-Month Averages 0.45 0.40 0.35 0.30 0.25 0.20 0.15 0.10 MDL 0.05 0.00 7/1/04 10/1/04 1/1/05 4/1/05 7/1/05 10/1/05 Asheville Garinger Winston Salem RTP Millbrook Wilmington Candor 15 Point Rolling Averages
Freon 12: 3-Month Averages 1.0 0.8 0.6 0.4 0.2 MDL 0.0 1/1/2004 4/1/2004 7/1/2004 10/1/2004 1/1/2005 4/1/2005 7/1/2005 10/1/2005 Asheville Garinger Winston-Salem RTP Millbrook Wilmington Candor 15 Point Rolling Averages
Carbon Tetrachloride 3-Month Averages 0.4 0.3 0.2 0.1 MDL URE 0.0 1/1/04 4/1/04 7/1/04 10/1/04 1/1/05 4/1/05 7/1/05 10/1/05 Asheville Garinger Winston Salem RTP Millbrook Wilmington Candor 15 Point Rolling Averages
Formaldehyde: 2004 National Program Candor RTP
Semivolatiles MDL
Semivolatiles MDL
VOC Annual Summaries: Asheville Percent Detect: Percent of total samples with detected values. nd: Not detected in any of the samples.
VOC Annual Summaries: Charlotte Percent Detect: Percent of total samples with detected values. nd: Not detected in any of the samples.
VOC Annual Summaries: Winston-Salem nd: Not detected in any of the samples Percent Detect: Percent of total samples with detected values.
VOC Annual Summaries: Raleigh nd: Not detected in any of the samples Percent Detect: Percent of total samples with detected values.
VOC Annual Summaries: RTP nd: Not detected in any of the samples Percent Detect: Percent of total samples with detected values.
VOC Annual Summaries: Wilmington nd: Not detected in any of the samples Percent Detect: Percent of total samples with detected values.
VOC Annual Summaries: Candor nd: Not detected in any of the samples Percent Detect: Percent of total samples with detected values.