Download
1 / 37
370 likes | 747 Views
NWSRFS Snow Modeling. Cold Regions Workshop November 2004 Andrea Holz NCRFC. North Dakota, 1966. Historic NWS Photo. SNOW-17 Model Overview. Input Variables Air Temperature 10 days of maximum/minimum point (CCF) forecasts May use gridded temperature forecasts soon (maybe next spring)

E N D
NWSRFS Snow Modeling Cold Regions Workshop November 2004 Andrea Holz NCRFC
North Dakota, 1966 Historic NWS Photo
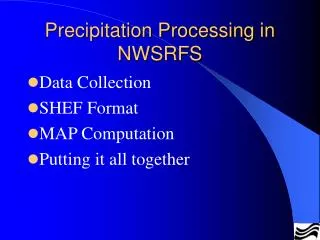
SNOW-17 Model Overview • Input Variables • Air Temperature • 10 days of maximum/minimum point (CCF) forecasts • May use gridded temperature forecasts soon (maybe next spring) • Precipitation • 24 Hours of QPF • 72 Hour QPF Contingency Forecasts • Output • Rain + Melt • Simulated Water Equivalent • Simulated Areal Extent of Snow Cover • Simulated Snow Depth
Other SNOW-17 Model calculations • Snow Pack Information • Accumulation of snow cover • Surface Energy Exchange • Heat storage in snow pack • Rain on snow event • Snow pack ripening • Liquid water retention • Ground Heat Exchange
Excavating Connelly Ditch, Minnesota, 1997 Photo Courtesy of St.Paul Corps of Engineers
SNOW-17 • Calculated on 6 Hour Time Intervals • Air temperature determines form of precipitation input • Can specify precipitation type during real time river forecasting • Can adjust melt rate based upon observed information • Dewpoints • Windspeeds • Observations from the field • Can change snow water equivalent values based on observed data
South Dakota, 1966 Historic NWS Photo
Example of SNOW-17 Output with observed values listed for comparison Observed Snow Depth Observed SWE Observed AESC
Can create Snow Depth or SWE “Areal Observations” • More than one observer in the basin • 2 or more observers outside of the basin, yet nearby • If one observation is missing for the day, no value is calculated – considered “missing” Historic NWS Photo
Tolerances used in Updating • Automatically update SWE or AESC by setting tolerances • SWE: Updating occurs if | sim – ob | > | tolerance x ob | • AESC: Updating occurs if | sim – ob | > tolerance
NCRFC Tolerances • High tolerances specified in the model prevent forecasters from making run time SWE or AESC modifications • To prevent automatic updates and to allow forecasters to make real time modifications, NCRFC does not display observed WE • Having ability to view observed WE would be operationally beneficial
River Forecasting using the Snow Model • Sturgeon River at Alston • Upper Peninsula of Michigan • Snow Melt & Rain on Snow Event • March, 2004 • For purposes of illustrating mods, observed AESC & WE are displayed
Sturgeon River at Alston No modifications 6 hour RAIM around 0.2 inches, March 28 - 29 FS Observations Simulation
SNOW-17 Output Precipitation on March 29 is 0.28 inches of snow + 0.06 inches of rain Keep in mind Energy Exchange value for future example Energy Exchange 0.5
Rain Snow Modification • Field observations of rain instead of snow • Rain/snow typing might be incorrect if there is an unknown temperature bias • Timing might be off for an event with rain turning to snow in the evening • Change precipitation typing in 6 hour increments • Difficult to determine which 6 hour time period to change since output is in 24 hour time steps
Rain/snow Modification 24 hours 6 hour RAIM over 0.5 inches, March 28 - 29
UADJ Mod – During Rain on Snow Events • Rain on Snow must exceed 2.5mm per 6 hours for model to simulate an increase in melt (tenth of an inch) • Modification can increase or decrease energy exchange • .UADJ March 28 12Z – 29 12Z ALSM4 5.0
Rain/snow + UADJ mods RAIM near 0.8 inches
UADJ 5.0March 28 - 29 Energy Exchange 0.85
Snow Water Equivalent Change Mod Observed values are listed in this table. Notice 3.9 inches on the 29th. 3.9” Observed Value
Water Equivalent Change Mod Changing WE during melt automatically changes AESC . . . Best approach: have WE values set before melt begins.
Near Little South Pembina River, North Dakota, 1997 Photo courtesy of St.Paul Corps of Engineers
Updating Snow Model No Modifications Same Example moving forward in time Too Much Peak FS Missed peak
SNOW-17 Model Output Melt already started . . . Watton SD Watton SWE NOHRSC AESC
Start run further back in carryover Melting begins . . .
SNOW-17 Output No Modifications Notice difference between Sim WE & Obs WE Energy Exchange = .17 - .71
Low Energy Exchange Low Energy Exchange About 15 mm of melt modeled in any 24 hours About 15mm of melt modeled in any 24 hours
Melt Factor Correction ModMarch 26 – 30, 2004 • .MFC 03260412Z – 03300412Z ALSM4 4.0 • During time of active melt • Meteorological conditions causing abnormal snowmelt • High dewpoints • High windspeeds • Difficult to forecast MFC into future • Watch meteorological forecasts closely • Possible temperature bias • Rain on snow Can also use MFC to slow down melt!
MFC 4.0 March 26 - 30 Energy Exchange Values Increase . . . Stimulating increase in melt Energy Exchange Values Increase .36 – 1.54
Increased Energy Exchange Increased Energy Exchange ~45mm of melt 45mm of melt
How does Late April Peak Perform Now? Within few tenths Caught peak
Current SNOW-17 Model • Current output in 24 hour time steps • Java display in 6 hour time steps? • Possible to display observed WE without automatically updating yet still have ability to make WE mods? • More Water Equivalent Data! • Other observations from the field • Water in ditches • Runoff under snowpack