Chapter 11: Waiting Line Models
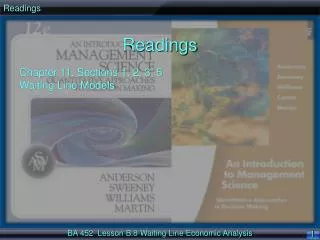
Chapter 11: Waiting Line Models. Instructor: Dr. Neha Mittal. Queuing theory is the knowledge dealing with waiting lines. Waiting Line Models consist of mathematical formulas and relationships that can be used to determine the operating characteristics for a waiting line.


Chapter 11: Waiting Line Models
E N D
Presentation Transcript
Chapter 11: Waiting Line Models Instructor: Dr. Neha Mittal
Queuing theory is the knowledge dealing with waiting lines. Waiting Line Models consist of mathematical formulas and relationships that can be used to determine the operating characteristics for a waiting line. They help in making decisions on the amount of capacity to be provided to give the desired service. Providing too much service involves excessive cost Providing too little service causes poor customer satisfaction, idle employees, etc. Achieves economic balance between cost of service and cost associated with waiting for that service. Queuing Theory/ Waiting Line Models
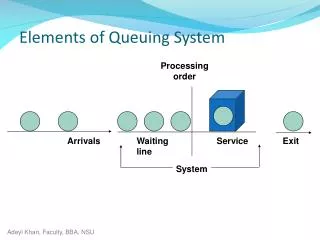
Structure of a Waiting Line System Single Channel Multiple Channels System Waiting line Customer arrives Customer leaves S1 System S1 Waiting line Customer arrives Customer leaves S2 S3
Key Characteristics of Waiting Line • There are four important characteristics of a queuing system: • Distribution of Arrival Times: the manner in which customers arrive • Distribution of Service Times: the time required for service • Queue Discipline: the priority determining the order of service • Server characteristics: the number and configuration of servers in the system
Structure of a Waiting Line System Distribution of Arrivals In most cases, the arrival of customers into the system is a random event It is modeled as a Poisson process Unusual behaviors (balking) are modeled using simulation. Distribution of Service Times Service time is also a random variable, in most cases. A distribution commonly used to describe it is the exponential distribution.
Distribution and Arrivals and Service Times • Probability of ‘x’ arrivals in the specific time period • Probability that service time will be less than or equal to a time of length (t)
Structure of a Waiting Line System Queue Discipline These are the rules that determine the order in which arrivals will be serviced Most common queue discipline is first come, first served (FCFS) Others are FCLS, LCFS, LCLS, etc. Can you think of an example of last come, first served (LCFS) queue discipline? Some other disciplines assign priorities to the waiting units and then serve the unit with the highest priority first
Queuing Systems A three part code of the form A/B/k is used to describe various queuing systems. A identifies the arrival distribution B the service (departure) distribution k the number of channels for the system
Queuing Systems • Symbols used for the arrival and service processes are: • M - Markov distributions (Poisson/exponential) • D - Deterministic (constant) • G - General distribution (with a known mean and variance) • For example, M/M/k refers to a system in which arrivals occur according to a Poisson distribution, service times follow an exponential distribution and there are k servers working at identical service rates
Analytical Formulas When the queue discipline is FCFS, analytical formulas have been derived for several different queuing models including the following: M/M/1 (focus for class) M/M/k M/G/1 M/G/k with blocked customers cleared Analytical formulas are not available for all possible queuing systems. In this event, insights may be gained through a simulation of the system
M/M/1 Queuing System Single channel/ single server Poisson arrival-rate distribution Exponential service-time distribution First come first serve queue discipline Unlimited maximum queue length (i.e., no balking) Infinite calling population
Operating Characteristics • Operating characteristics are assumed to approach a steady state
Probability of n customers in queuing system average number of customers in queuing system average number of customers in waiting line ( ) ( )( ) λnλnλ μμμ Pn= ∙ P0 = 1 – λ μ – λ L = λ2 μ (μ – λ) Lq = Single-Server Model
average time customer spends in queuing system average time customer spends waiting in line probability that server is busy and a customer has to wait (utilization factor) probability that server is idle and customer can be served 1 L μ – λλ W = = λ μ (μ – λ) Wq= λ μ ρ = I = 1 – ρ = 1 – = P0 λ μ
Example: SJJT, Inc. (A) M/M/1 Queuing System Joe Ferris is a stock trader on the floor of the New York Stock Exchange for the firm of Smith, Jones, Johnson, and Thomas, Inc. Stock transactions arrive at a mean rate of 20 per hour. Each order received by Joe requires an average of two minutes to process.
Arrival Rate Distribution Question What is the probability that no orders are received within a 15-minute period? Answer P (x = 0) = (50e -5)/0! = e -5 = .0067
Arrival Rate Distribution Question What is the probability that exactly 3 orders are received within a 15-minute period? Answer P (x = 3) = (53e -5)/3! = 125(.0067)/6 = 0.1396
Arrival Rate Distribution Question What is the probability that more than 6 orders arrive within a 15-minute period? Answer P (x > 6) = 1 - P (x = 0) - P (x = 1) - P (x = 2) - P (x = 3) - P (x = 4) - P (x = 5) - P (x = 6) = 1 - .762 = .238
Service Rate Distribution Question What is the mean service rate per hour? Answer Since Joe Ferris can process an order in an average time of 2 minutes (= 2/60 hr.), then the mean service rate, µ, is µ = 1/(mean service time), or 60/2. m = 30/hr.
Service Time Distribution Question What percentage of the orders will take less than one minute to process? Answer Since the units are expressed in hours, P (T< 1 minute) = P (T< 1/60 hour). Using the exponential distribution, P (T<t ) = 1 - e-µt. Hence, P (T< 1/60) = 1 - e-30(1/60) = 1 - .6065 = .3935 = 39.35%
Service Time Distribution Question What percentage of the orders will be processed in exactly 3 minutes? Answer Since the exponential distribution is a continuous distribution, the probability a service time exactly equals any specific value is 0.
Service Time Distribution Question What percentage of the orders will require more than 3 minutes to process? Answer The percentage of orders requiring more than 3 minutes to process is: P (T > 3/60) = e-30(3/60) = e-1.5 = .2231 = 22.31%
Average Time in the System Question What is the average time an order must wait from the time Joe receives the order until it is finished being processed (i.e. in the system, its turnaround time)? Answer This is an M/M/1 queue with = 20 per hour and = 30 per hour. The average time an order waits in the system is: W = 1/(µ - ) = 1/(30 - 20) = 1/10 hour or 6 minutes
Average Length of Queue Question What is the average number of orders in the line that Joe has waiting to be processed? Answer Average number of orders waiting in the queue is: Lq = 2/[µ(µ - )] = (20)2/[(30)(30-20)] = 400/300 = 4/3
Utilization Factor Question What percentage of the time is Joe processing orders? Answer The percentage of time Joe is processing orders is equivalent to the utilization factor, /. Thus, the percentage of time he is processing orders is: / = 20/30 = 2/3 or 66.67%
Practice Problems (1/4) • An airline terminal has several terminal gates at the Hartsfield International Airport in Atlanta. Under normal conditions the airline assigns one operator to the desk at each gate to serve passengers, including making seat assignments, checking passengers in, rerouting passengers, and solving customer problems. At one specific gate that is in constant use throughout the day, passengers arrive at the desk at the rate of 80 per hour according to a Poisson distribution. The airline agent is able to serve passengers in an average time of 0.667 minutes, exponentially distributed. Determine L, Lq, W, and Wq for this waiting line system.
Practice Problems (2/4) • A gas station has one pump for gasoline, which can serve 10 customers per hour. Cars arrive at the pump at a rate of 5 per hour. Determine the average queue length, the average time a car is in the system, and the average time a car must wait. • If during the period from 4:00 – 5:00 PM, the arrival rate increases to 12 cars per hour, what will be the effect on the average queue length?
Practice Problems (3/4) • The ticket booth on the Tech campus is operated by one person, who is selling tickets for the Annual Tech Vs. State football game on Saturday. The ticket seller can serve an average of 12 customers per hour and on average 8 customers arrive to purchase the tickets per hour. Determine the average time a ticket buyer must wait before he reaches the seller, and the portion of time the ticket seller is busy.
Practice Problems (4/4) • The auxilliary bookstore in the student center at Tech is a small facility that sells school supplies and snacks. It has one checkout counter where one employee operates the cash register. The combination of the cash register and the operator is the server in this waiting line system; the customers who line up at the counter to par for their selections form the waiting line. Customers arrive at a rate of 24 per hour according to a Poisson distribution and service times are exp. distributed, with a mean of 30 customers per hour. The bookstore manager wants to determine the operating characteristics for this waiting line system.
Assignment 8 1. In a waiting line situation, arrivals occur at a rate of 2 per minute, and the service times average 12 seconds. Assume the Poisson and exponential distributions. 2. During summer weekdays, boats arrive at the inlet drawbridge according to the Poisson distribution at a rate of 3 per hour. In a 2-hour period, a. what is the probability that no boats arrive? b. what is the probability that 2 boats arrive? c. what is the probability that 8 boats arrive?
3. The time to process a registration at the Sea View Resort follows the exponential distribution and has a mean of 6 minutes. a. What is the probability of a registration time shorter than 3 minutes? b. What is the probability of a registration time shorter than 6 minutes? c. What is the probability of a registration time between 3 and 6 minutes? 4. The Grand Movie Theater has one box office clerk. On average, each customer that comes to see a movie can be sold its ticket at the rate of 6 per minute. For the theater's normal offerings of older movies, customers arrive at the rate of 3 per minute. Assume arrivals follow the Poisson distribution and service times follow the exponential distribution.