Download
1 / 61
620 likes | 980 Views
The Reconstruction of Mechanically Recorded Sound by Image Processing. Vitaliy Fadeyev and Carl Haber Physics Division Lawrence Berkeley National Lab Berkeley, California USA. Outline. Introduction Background History Issues The Imaging Method Basic Idea Advantages

E N D
The Reconstruction of Mechanically Recorded Sound by Image Processing Vitaliy Fadeyev and Carl Haber Physics Division Lawrence Berkeley National Lab Berkeley, California USA Topics in Preservation Science Lecture Series The Library of Congress
Outline • Introduction • Background • History • Issues • The Imaging Method • Basic Idea • Advantages • Detailed Discussion of Elements • Context • Proof of Concept Test • Conclusions Topics in Preservation Science Lecture Series The Library of Congress
Lawrence Berkeley National Labwww.lbl.gov • Founded in 1931 by E.O.Lawrence • Oldest of US National Labs • Operated by the University of California for the US DoE • 4000 Staff, 800 Students, 2000 Guests • 14 Research Divisions including • Physics, Nuclear Science • Materials, Chemical Science • Life Sciences, Physical Bioscience • Energy and Environment, Earth • Computing • Major user facilities- • Advanced Light Source • Nat. Center for Electron Microscopy • Nat. Energy Research Super Computer Center Topics in Preservation Science Lecture Series The Library of Congress
Introduction • We have investigated the problem of optically recovering mechanical sound recordings without contact to the medium • This work may address some concerns of the preservation, archival, and research communities: • The reconstruction of damaged media • The playback of delicate media • Mass digitization and storage • Message to take away from today’s presentation: • Optical techniques can produce acceptable reproductions and some improvements • Measurement, data storage, and computing technologies may be approaching performance levels required for this application • Cross disciplinary interactions can be of real value here Topics in Preservation Science Lecture Series The Library of Congress
History • Recorded sound was introduced by Edison in 1877 who embossed audio data onto metal foil • A variety of media and methods used since then • Wax cylinders with vertical modulation • Shellac disks with vertical or lateral modulation • Vinyl disks with lateral or 45/45 (stereo) modulation • Acetate instantaneous recordings, lateral modulation • Metal reversed stampers (disks) and galvanos (cylinders) • Magnetic tape and wire • Compact digital disks (CD) • Essentially all pre-1948 recordings were mechanical Topics in Preservation Science Lecture Series The Library of Congress
Issues and Concerns • Can recordings be mass digitized in an efficient way to enable preservation and access for future users? • Diverse formats • Damaged samples which require intervention or are impossible to play at all • Further damage to delicate samples • Can samples which are of particular value to someone be recovered or improved in a useful way? Topics in Preservation Science Lecture Series The Library of Congress
A Non-contact Method • Using optical techniques, the pattern of grooves or undulations in a recording surface can be imaged. • To cover a surface (thousands of) sequential views can be acquired. • Views can be stitched together. • The images can be processed to remove defects and analyzed to model the stylus motion. • The stylus motion model can be sampled at a standard frequency and converted to digital sound format. • Real time playback is not required de-facto, method is aimed at reconstruction and digitization. Topics in Preservation Science Lecture Series The Library of Congress
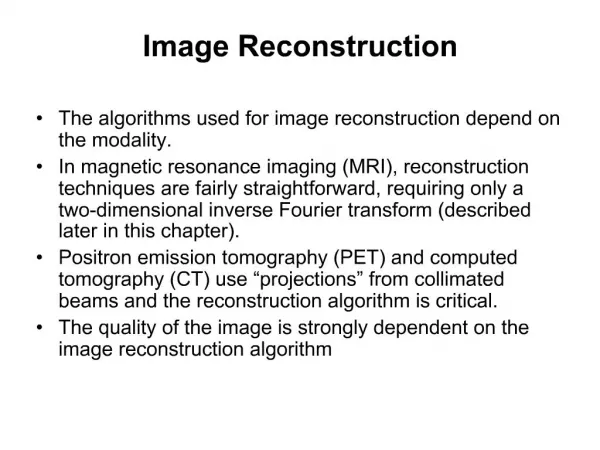
Example of Groove Image • Two dimensional view (2D) • Field is 1.39 x 1.07 mm • Groove width is 160 mm • Lighting is perpendicular to surface. • Bright line is groove bottom. • Acquired with a digital camera and magnification. Dust particle Small scratch Groove bottom Record surface Topics in Preservation Science Lecture Series The Library of Congress
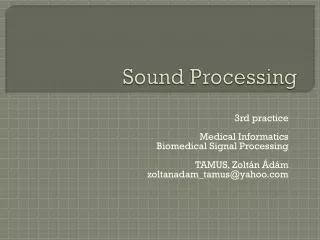
Example of 3D Images: Surface Profiles 60 mm 18 mm 30 mm 1 mm 0.912 mm 2.2 mm 0 mm Edison “Blue Amberol” cylinder 78 rpm disk with large scratch • Fields are few mm2 • Acquired with confocal laser scanning probe • Suitable for detailed groove reconstruction and vertical modulated recordings Topics in Preservation Science Lecture Series The Library of Congress
Topics in Preservation Science Lecture Series The Library of Congress
Advantages of Imaging Method • Delicate samples can be played without further damage. • Broken samples can be re-assembled virtually. • Independent of record material and format – wax, metal, shellac, acetates… • Effects of damage and debris (noise sources) can be reduced through image processing. Scratched regions can be interpolated. • Discrete noise sources are resolved in the “spatial domain” where they originate rather than as an effect in the audio playback. • Dynamic effects of damage (skips, ringing) are absent. • Classic distortions and systematics (wow, flutter, tracing and tracking errors, pinch effects etc) are absent or removed as geometrical corrections • No mechanical method needed to follow the groove. • Suggests a method for mass digitization, full 3D maps. Topics in Preservation Science Lecture Series The Library of Congress
Material and Format Independence • Image of metal “stamper” used to mold plastic record. • Molding technology is obsolete. • Can be played with special “cowboy” stylus which rides ridges • But easily imaged in 2D Topics in Preservation Science Lecture Series The Library of Congress
Dynamic Effects • Continuum of imperfections up to a full skip. • Mechanical stylus responds dynamically to these imperfections • Result is a “ringing” which may persist as an artifact if only clicks are removed in a standard digital remastering • Plot is from Rayner, Vaseghi, and Stickells, FIAF Joint Technical Symp, “Archiving the Audio-Visual Heritage”, May 20-22, 1987 Topics in Preservation Science Lecture Series The Library of Congress
Relationship to Other Work • Laser turntables (ELP): these devices work off a reflected laser spot only and are susceptible to damage and debris and sensitive to surface reflectivity. • Stanke and Paul, “3D Measurement and modelling in cultural applications”, Inform. Serv. & Use 15 (1995) 289-301: use of image capture to read cylinder “galvanos”, depth was sensed from greyscale in 2D image – lacks resolution required for good reconstruction. Topics in Preservation Science Lecture Series The Library of Congress
Relationship to Other Work • S.Cavaglieri, Johnson, and Bapst, Proc of AES 20th International Conference, Budapest, Oct 5-7, 2001: use of photographic contact prints and scanner to archive groove pattern in 2D – insufficient resolution, no 3D analog. • O.Springer (http://www.cs.huji.ac.il/~springer/): use of desk top scanner on vinyl record – lacks resolution for useful reconstruction, no notion of magnification nor image processing to improve data. • Penn et al at Belfer Lab: no information available, some sort of real time interferometric playback system (??), no notion of image processing Topics in Preservation Science Lecture Series The Library of Congress
Elements • Imaging • Requires sufficient resolution to measure the minimal undulations of the surface. The scale is ~0.2-1 mm (lateral) for the pre-vinyl era. • Lateral recordings can be imaged in 2D or 3D. • Cylinders, vertical disks, and complex damage structures require 3D • Method must be fast enough for efficient application. • Processing • Effective algorithms to capture information content of grooves and reject noise. • Analysis • Transform spatial pattern of groove position into audio response – physical model. • Conversion to standard audio formats Topics in Preservation Science Lecture Series The Library of Congress
Topics in Preservation Science Lecture Series The Library of Congress
Imaging Methods • Electronic Cameras – 2D or horizontal only view, frame based • Confocal Scanning – 3D or vertical+horizontal view, point based • Chromatic sensors – 3D, point based • White Light Interferometry – 3D, frame based Topics in Preservation Science Lecture Series The Library of Congress
Electronic Camera • CCD or CMOS image sensor • Practical field of view is 0.7 x 0.54 mm • Camera contains 768 x 494 pixels, up to few Mega-Pixels • 1 pixel = 0.91 x 1.09 microns on the record surface • Magnification and pixel size yield sufficient resolution for audio data measurement due to pixel interpolation • Entire frames acquired at 30-1000 fps (up to 10,000 fps possible) Topics in Preservation Science Lecture Series The Library of Congress
Laser Confocal Scanning Microscope Lens scans depth • Acquires image point by point • Vertical resolution is ~0.1 micron • Commercially available • Point light source is reflected from measurement surface and detected at point detector. Only in-focus rays give signal in detector. • Complete depth scan occurs 1400 times/sec for each point, averaging? • Horizontal resolution set by point size 1-2 microns Topics in Preservation Science Lecture Series The Library of Congress
Chromatic Confocal Sensor • Different colors image to different depths on the sample simultaneously – potential for faster scan, up to 4000 points/second may be possible, depending on surface • Signal detected by spectrometer (color sensitive). • Issue of reflection off sloped surfaces – data loss Topics in Preservation Science Lecture Series The Library of Congress
Chromatic Confocal Sensor Topics in Preservation Science Lecture Series The Library of Congress
White Light Interferometry • Interference principle – waves combine constructively for equal distances traveled. • Sample is scanned in depth and imaged by frames, at each depth a different interference pattern is found. Frame size is typically 0.6 x 0.4 mm. • Horizontal resolution is like 2D electronic camera but takes many vertical slices. • Current systems run 60 fps and require 1-20 seconds per view for vertical scan. • Scan time depends upon surface angle and reflectivity. • Potential for faster systems with high fps cameras? Topics in Preservation Science Lecture Series The Library of Congress
White Light Interferometry Image from 78 rpm record surface Issue of data loss from groove sides – angle effect, time required to measure Topics in Preservation Science Lecture Series The Library of Congress
White Light Interferometry: Scratch Topics in Preservation Science Lecture Series The Library of Congress
Image Processing • Each image consists of a set of “pixels” • A pixel is an intensity or height measurement at a horizontal position (x,y) • Image processing is a collection of mathematical operations performed on the pixels to extract information from the image, including: • Measure profiles and distances • Find transitions (edge detection) • Shape detection (morphology) and transformation • Alter values based upon neighboring pixels (filtering) Topics in Preservation Science Lecture Series The Library of Congress
Image Processing • Brightness profile in grayscale image across a feature • Edge detection along a series of lines Topics in Preservation Science Lecture Series The Library of Congress
Image Processing Effect of iterated “dilation” operator on 1x3 pixel clusters Dust particle is removed from the image Topics in Preservation Science Lecture Series The Library of Congress
Signal Analysis • Once the groove pattern is properly imaged and acquired an analysis is performed to extract the audio data. • Based upon the physics of the recording process. • Groove data is already in digital form so analysis methods are numerical. Topics in Preservation Science Lecture Series The Library of Congress
Physics of Mechanical Sound Recording • Playback stylus rides in groove • For magnetic recording and playback stylii, signal is proportional to stylus velocity “constant velocity recording” • Mediated by equalization scheme to attenuate low frequencies and boost high frequencies • Levels are compared by amplitude Amplitude Max. Slope Wavelength Topics in Preservation Science Lecture Series The Library of Congress
Equalization and Reconstruction • The constant velocity recording characteristic is modified as follows: • Low frequencies are attenuated to avoid excessive groove excursion • High frequencies are boosted above surface noise floor • Playback is equalized to compensate for this. • Optical reading of groove displacement is differentiated numerically to determine stylus velocity and then equalized Topics in Preservation Science Lecture Series The Library of Congress
Speed of Method (1) • Frame based methods • Overlapping images to enable stitching – 20% • Assume 0.7 x 0.54 mm = 0.378 mm2 frame • 78 rpm disk: 38600 mm2 = 123,000 frames, @30 fps: 1.2 hours/scan (realtime: 680 fps) • Cylinder: 16200 mm2 = 51,000 frames, but vertical scan requires 1-10 seconds per frame: 14 -140 hours per scan (with 60 fps camera) Topics in Preservation Science Lecture Series The Library of Congress
Speed of Method (2) • Point scan based methods (confocal microscopes) • Very sensitive to number of points required for reconstruction • High density example: 4x4 mm grid: • 78 rpm disk: 152 meters x 160 mm: 1.5 billion points, @1000 points/second: 400 hours per scan • Cylinder: 16200 mm2 : 1 billion points, @4000 points/second: 70 hours per scan (better surface angle) • Low density example: sample groove with 3 points across, at 8 mm intervals along length. Identify defects and return with high density selectively. • 78 rpm disk: 3 x 152 meters / 8 mm = 57 million points, @1000 points/second: 16 hours per scan • Cylinder ~3 hours per scan Topics in Preservation Science Lecture Series The Library of Congress
Speed of Method - Comments • Discussion only covered image acquisition, but data transmission, real time processing, and storage requirements are also significant. • Raw 2D images of 78 rpm disk: 570 Mbytes per second of audio data (88 Kbytes/sec in WAV file) • Immediate pre-processing (DSPs) could provide reduction. • Only 2D camera is reasonably efficient for mass digitization (?). Slow scans OK for special reconstructions. But 3D required for cylinders. Topics in Preservation Science Lecture Series The Library of Congress
Speed of Method - Comments • 3D methods have excessive vertical resolution, perhaps some time could be recovered with relaxed vertical scan protocol? • Speed of 3D surface profilers could increase with new technologies (faster cameras, higher frequency drivers…) recall – none of this was possible 10 years ago. • Topic is ripe for collaboration with 3D surface profiling industry. Topics in Preservation Science Lecture Series The Library of Congress
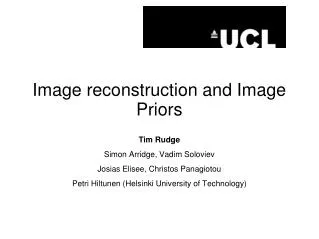
Context • The methods and techniques described here may be unfamiliar in an audio engineering context. • They are however widely used in other fields. • Automated inspection • Microbiology • Security and military • From an experimental particle physics context this approach seemed natural. Topics in Preservation Science Lecture Series The Library of Congress
Particle Physics Methods High energy accelerators are used to study basic nature of matter and energy and to re-create conditions of the early universe. Fermilab CDF Detector Silicon sensor array >Precision mechanical survey methods are required to build sensor array >Massive data collection and analysis >Pattern recognition and image processing to analyze signals and noise observed in detectors Computer event display Topics in Preservation Science Lecture Series The Library of Congress
Photograph of bubbles formed along the trajectory of an electron as it loses energy in a “Bubble Chamber”. Measurement of tracks in a particle detector is similar to following the groove in a mechanical recording – pattern recognition, noise reduction issues are familiar. Measurement methods and precision required to build detectors are similar to that required for audio reconstruction Topics in Preservation Science Lecture Series The Library of Congress
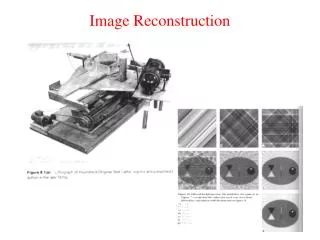
Test of Concept using 2D Imaging • Precision optical metrology system already in use for Particle Physics detector construction at LBL. Non-contact. • “SmartScope” manufactured by Optical Gauging Products. • System features zoom microscope with electronic camera and precision stage motion in x-y-z. • Includes image acquistion with pattern recognition and analysis & reporting software • Wrote program to scan grooves, report, and process data (offline). Topics in Preservation Science Lecture Series The Library of Congress
The SmartScope Program Intervals on two sides of the illuminated band are measured An algorithm was devised to follow the groove approximately spiraling to the disk center: Geometrical center of the two intervals is constructed * Consecutive interval pairs overlap by 25% for redundancy Coordinates are shifted to the center and rotated, so that the X axis points to the disk center (hole) * X Disk Center Y X Topics in Preservation Science Lecture Series The Library of Congress
Example of Smart Scope Edge Finding on Groove Bottom Topics in Preservation Science Lecture Series The Library of Congress
Technical Issues • System used was general purpose, not optimized for this application. It required ~40 minutes to scan 1 second of audio. • No image recording (for offline use), system performed processing up front with built in software. Output data were found points along features. • Automatic noise reduction due to rejection of dust or scratches in edge finding process. Also used bottom width measurement as a noise rejection tool offline. • Number of points along groove, could be increased. • 8 mm steps = 66 KHz sampling • Merging of adjacent frames • Groove pattern must be differentiated numerically- algorithm selection Topics in Preservation Science Lecture Series The Library of Congress
Offline Data Processing 1 Reformatting data in one global coordinate system 2 Removal of big outliers Filtering by selecting on the distance between interval pair; merging two sides into one. 3 4 Matching the adjacent frames 5 Fit the groove shape R’=R0+C*f’+A*sin2(f’ + f0) Differentiation 6 7 Resampling; multiple runs addition; conversion to WAV format Topics in Preservation Science Lecture Series The Library of Congress
Raw data after step (1) Gap between two edges [mm] We impose 2.5 sigma cut to reduce noise. Merged data after step (3) Topics in Preservation Science Lecture Series The Library of Congress
Issue of Edge Quality in 2D Image Poor edge definition Good edge definition Topics in Preservation Science Lecture Series The Library of Congress
Noise Sources • Surface noise or hiss • High frequency due to continuous imperfections in groove surface • Transient impulse noise or “clicks and pops” • Due to discrete imperfections such as scratches, random and isolated • Wow and flutter • Not really noise, systematic distortions such as motor speed, off axis rotation Stylus playback click/pop hiss Direct studio tape recording Topics in Preservation Science Lecture Series The Library of Congress
Results: 1st Sample • Sample is 19.1 seconds • From ~1950 78 rpm disk • Top: Imaging method • Middle: Played by stylus • Bottom: Professionally re-mastered CD version • Record was not cleaned. • No “standard” digital noise reduction software used. Topics in Preservation Science Lecture Series The Library of Congress
Zoom In for Detailed Comparison • 40 ms portion shown • Striking similarity between optical and stylus reconstruction • Optical lacks clips and pops, certain noise features, high frequency structures (~10 kHz) • Qualitative match to CD/tape version Topics in Preservation Science Lecture Series The Library of Congress
Frequency Spectra • FFT spectra of optical (top), stylus (middle), and CD/tape (bottom) • Audio content in range 100 - 4000 Hz very similar • More high frequency content in stylus version • Effects of equalization and differentiation? • Low frequency structure in optical sample (audible). 2 4 14 34 134 1234 5234 20K Topics in Preservation Science Lecture Series The Library of Congress
Sound Comparison “Goodnight Irene” by H. Ledbetter (Leadbelly) and J.Lomax, performed by The Weavers with Gordon Jenkins and His Orchestra ~1950 Sound from the CD of re-mastered tape. Sound from the mechanical (stylus) readout. Sound from the optical readout. Topics in Preservation Science Lecture Series The Library of Congress