Download

1 / 49
500 likes | 733 Views
Evidence for the problem. Cesarean Section ratesHealthy People 2000 goalsHealthy People 2010 goals. Healthy People 2000. Background: rise in overall c/sec rate from 5.5% in 1970 to 24.4% in 1987Healthy People 2000 goal was a 15% overall national c/sec rate . Progress toward 2000 Goal. Early 1990'

E N D
1. The Dystocia Epidemic in Nulliparous Women June 12, 2005
Nancy K. Lowe, CNM, PhD, FACNM, FAAN
Professor, Division of Nurse-Midwifery
School of Nursing
Oregon Health & Science University
2. Evidence for the problem Cesarean Section rates
Healthy People 2000 goals
Healthy People 2010 goals
3. Healthy People 2000 Background: rise in overall c/sec rate from 5.5% in 1970 to 24.4% in 1987
Healthy People 2000 goal was a 15% overall national c/sec rate
4. Progress toward 2000 Goal Early 1990�s progressive improvement occurred
20.7% in 1996
Later 1990�s this trend reversed
22.9% in 2000
5. Essentially the Feds �gave up� Goal for overall c/sec rate was abandoned in Healthy People 2010 and the rate continues to climb
24.4% in 2001
26.1% in 2002
27.6% in 2003
6. Percentage of All Births by Cesarean Section This graph shows the overall (in light blue) and primary cesarean section rates (in yellow) in the U.S. from 1989 through 2003, the last year for which national data are available. 1989 was the PANIC year. What we see is the gradual progress that was made in reducing both the primary and overall rates in the early to mid-1990s. In 1998, both rates began a steady upward curve with rates climbing by 5 to 6% annually for the past 4 years (2000, 2001, 2002, and 2003). In 2002, we crossed the mark of more than 1 in every 4 women who gave birth in the United States annually experienced cesarean section delivery.
This graph shows the overall (in light blue) and primary cesarean section rates (in yellow) in the U.S. from 1989 through 2003, the last year for which national data are available. 1989 was the PANIC year. What we see is the gradual progress that was made in reducing both the primary and overall rates in the early to mid-1990s. In 1998, both rates began a steady upward curve with rates climbing by 5 to 6% annually for the past 4 years (2000, 2001, 2002, and 2003). In 2002, we crossed the mark of more than 1 in every 4 women who gave birth in the United States annually experienced cesarean section delivery.
7. Percentage of Total and Primary C/Sec and VBAC One major element in the dramatic increase in the overall cesarean rate is the dramatic decline in VBAC that began precipitously in 1998. The VBAC rate in 2003 was only 10.6%, a 16% decline from 12.6% in 2002. Overall, the VBAC rate has plunged 63% since 1996, while the primary cesarean section rate has climbed 31%. One major element in the dramatic increase in the overall cesarean rate is the dramatic decline in VBAC that began precipitously in 1998. The VBAC rate in 2003 was only 10.6%, a 16% decline from 12.6% in 2002. Overall, the VBAC rate has plunged 63% since 1996, while the primary cesarean section rate has climbed 31%.
8. Healthy People 2010 One goal related to cesarean section:
16-9. Reduce cesarean births among low-risk (full term, singleton, vertex presentation) women.
16-9a. Women giving birth for the first time.
16-9b. Prior cesarean birth.
9. 16-9 Reduce Cesarean Births among Low-Risk Women.
10. Progress toward goals These data come from the National Center for Health Statistics, Healthy People 2010 Data website. These data come from the National Center for Health Statistics, Healthy People 2010 Data website.
11. 16.9a Reduce Cesarean Births among Low-Risk Women Giving Birth for the First Time � Projection based on trend
12. State Specific Statistics 1998: 16 states (32%) met the 15% target
2000: only 9 states (17.6%) met the 15% target 2001: only 3 states (Utah, New Mexico and Idaho) remain at or below the 15% target
2002: only 2 states (Utah & NM) remain at or below the 15% target 1998: Lowest rate was 12% in 3 states: Alaska, Idaho and Utah. My two favorite �O� states (Oregon and Ohio) were right at 15%.
2000: in 5 of these 9 states the rates had risen although they remained at or below the 15% target. Oregon and Ohio were both now at 17%. In this two-year time-frame, only two states, Montana and Hawaii, had actually reduced their c/sec rates for women giving birth for the first time. In 47% or 24 states the rate rose each year from 1998 until 2000. In 23 states (45%), the year 2000 rate for first-time mothers was > 20%.
2001: Only two states (North Dakota and South Dakota) had declines in the rate for first-time mothers (17% to 16% and 20% to 18% respectively). In all other states (86%) including DC, the rate rose from 2000 to 2001. A new all time single-state high was reached in Louisiana at 27%. In Oregon, the 2001 rate was 18%.
2002: Although the Final Natality Report for 2002 was released by NCHS this fall, these data for the Healthy People 2010 goals have not yet been updated. They should be available on the NCHS website in April.
1998: Lowest rate was 12% in 3 states: Alaska, Idaho and Utah. My two favorite �O� states (Oregon and Ohio) were right at 15%.
2000: in 5 of these 9 states the rates had risen although they remained at or below the 15% target. Oregon and Ohio were both now at 17%. In this two-year time-frame, only two states, Montana and Hawaii, had actually reduced their c/sec rates for women giving birth for the first time. In 47% or 24 states the rate rose each year from 1998 until 2000. In 23 states (45%), the year 2000 rate for first-time mothers was > 20%.
2001: Only two states (North Dakota and South Dakota) had declines in the rate for first-time mothers (17% to 16% and 20% to 18% respectively). In all other states (86%) including DC, the rate rose from 2000 to 2001. A new all time single-state high was reached in Louisiana at 27%. In Oregon, the 2001 rate was 18%.
2002: Although the Final Natality Report for 2002 was released by NCHS this fall, these data for the Healthy People 2010 goals have not yet been updated. They should be available on the NCHS website in April.
13. 2002 State First Birth C/Section rates < 15%: 2 states (Utah & NM)
16 � 19%: 11 states
20 � 24%: 27 states
> 25%: 9 states (including D.C.) < 15%: Utah and New Mexico
16 � 19%: Alaska, Arizona, Colorado, Hawaii, Idaho, Minnesota, Montana, South Dakota, Vermont, Wisconsin, Wyoming
20 � 24%: California, Connecticut, Delaware, Georgia, Illinois, Indiana, Iowa, Kansas, Kentucky, Maine, Maryland, Massachusetts, Michigan, Missouri, Nebraska, Nevada, New Hampshire, New York, North Carolina, Ohio, Oklahoma, Oregon, Pennsylvania, Rhode Island, Tennessee, Texas, Washington
> 25%: Alabama, Arkansas, District of Columbia, Florida, Louisiana, Mississippi, New Jersey, South Carolina, Virginia
AND THE WINNER IS. . . .Louisiana at 28% cesarean section rate for women giving birth for the first time.
Further, in only FIVE states did the rate EVER decline since the baseline year of 1998.
Hawaii, whose 1998 rate of 15% declined to 12% in 2000, before jumping to 16% in 2001 and 17% in 2002.
Montana, whose 1998 rate of 16% declined to 13% in 1999, before beginning its upward trend to 17% in 2002.
South Dakota, whose 1998 rate of 17% rose to 20% in 2000, and declined to 18% in 2001, rose to 19% in 2001.
Utah, whose 1998 rate of 12% declined to 11% in 1999, before rising progressively to 14% in 2002
Wyoming, whose rate has varied between 16 and 18% since 1998.< 15%: Utah and New Mexico
16 � 19%: Alaska, Arizona, Colorado, Hawaii, Idaho, Minnesota, Montana, South Dakota, Vermont, Wisconsin, Wyoming
20 � 24%: California, Connecticut, Delaware, Georgia, Illinois, Indiana, Iowa, Kansas, Kentucky, Maine, Maryland, Massachusetts, Michigan, Missouri, Nebraska, Nevada, New Hampshire, New York, North Carolina, Ohio, Oklahoma, Oregon, Pennsylvania, Rhode Island, Tennessee, Texas, Washington
> 25%: Alabama, Arkansas, District of Columbia, Florida, Louisiana, Mississippi, New Jersey, South Carolina, Virginia
AND THE WINNER IS. . . .Louisiana at 28% cesarean section rate for women giving birth for the first time.
Further, in only FIVE states did the rate EVER decline since the baseline year of 1998.
Hawaii, whose 1998 rate of 15% declined to 12% in 2000, before jumping to 16% in 2001 and 17% in 2002.
Montana, whose 1998 rate of 16% declined to 13% in 1999, before beginning its upward trend to 17% in 2002.
South Dakota, whose 1998 rate of 17% rose to 20% in 2000, and declined to 18% in 2001, rose to 19% in 2001.
Utah, whose 1998 rate of 12% declined to 11% in 1999, before rising progressively to 14% in 2002
Wyoming, whose rate has varied between 16 and 18% since 1998.
14. Significance of the problem 1998 estimate that > 40% of cesareans were unnecessary; a 25% reduction would save $750 million annually
ACOG 2000 Report
Greatest variation in primary c/sec rates occur among nulliparous women at term with singleton fetus in vertex presentation without complications 1998 report �As good as it should get: Making health care better in the new millenium� by Berwick of the Institute for Health Care Improvement. Estimated that at least 40% of the approximately 1 million c/sec performed in the U.S. each year were unnecessary and that a reduction of only 25% would save approximately $750 million health care dollars annually.
However, a 2003 study published in the American Journal of Obstetrics & Gynecology whose purpose was �to estimate the cost differences between elective cesarean delivery and the alternative of attempted vaginal delivery and to asses the economic impact of cesarean delivery on demand� concluded that �the adoption of a policy of cesarean delivery on demand should have little impact on the overall cost of obstetric care�. The analysis showed that the average cost for all women who attempted vaginal delivery was only 0.2% less than the per-patient cost of elective cesarean delivery.
In 2000, ACOG noted that across the U.S. the greatest variation in primary cesarean section rates occurs among nulliparous women with term singleton fetuses in vertex presentations without complications. The ACOG report further concluded that there is no evidence that higher cesarean section rates in these low risk nulliparous women result in improved outcomes.
THIS IS THE KEY ISSUE1998 report �As good as it should get: Making health care better in the new millenium� by Berwick of the Institute for Health Care Improvement. Estimated that at least 40% of the approximately 1 million c/sec performed in the U.S. each year were unnecessary and that a reduction of only 25% would save approximately $750 million health care dollars annually.
However, a 2003 study published in the American Journal of Obstetrics & Gynecology whose purpose was �to estimate the cost differences between elective cesarean delivery and the alternative of attempted vaginal delivery and to asses the economic impact of cesarean delivery on demand� concluded that �the adoption of a policy of cesarean delivery on demand should have little impact on the overall cost of obstetric care�. The analysis showed that the average cost for all women who attempted vaginal delivery was only 0.2% less than the per-patient cost of elective cesarean delivery.
In 2000, ACOG noted that across the U.S. the greatest variation in primary cesarean section rates occurs among nulliparous women with term singleton fetuses in vertex presentations without complications. The ACOG report further concluded that there is no evidence that higher cesarean section rates in these low risk nulliparous women result in improved outcomes.
THIS IS THE KEY ISSUE
15. Questions? Why is the rate increasing rather than decreasing among the lowest risk women giving birth for the first-time?
What can be done to reverse the trend?
16. Why do low-risk women giving birth for the first-time have cesareans? Breech � Approximately 3% incidence
Preeclampsia - Approximately 7.5% incidence
Dystocia � Accounts for at least 2/3 of cesareans
Fetal Distress (Labor intolerance with non reassuring heart rate tracings)
Elective � social intolerance for labor Breech: 45-75% of these should have successful external version to cephalic
Preeclampsia: route of delivery is affected in a very small percentage of these
Fetal distress: occurs in around 3% of ALL births. Accounts for about 12-13% of PRIMARY cesareans. Breech: 45-75% of these should have successful external version to cephalic
Preeclampsia: route of delivery is affected in a very small percentage of these
Fetal distress: occurs in around 3% of ALL births. Accounts for about 12-13% of PRIMARY cesareans.
17. Primary Cesarean Indications Data from the National Center for Health Statistics National Hospital Discharge Survey for 1985 and 1994 (414 and 478 hospitals respectively). Data from the National Center for Health Statistics National Hospital Discharge Survey for 1985 and 1994 (414 and 478 hospitals respectively).
18. Why do low-risk women giving birth for the first-time have cesareans? Breech
Preeclampsia
Dystocia
Fetal Distress (Labor Intolerance)
Elective
19. Dystocia � What is it? General term for difficult or abnormal labor
Clinical terms
Dysfunctional labor
Failure to progress
Cephalopelvic or fetopelvic disproportion
Malposition
Dystocia is not a diagnostic label.
Dystocia can result from abnormalities primarily involving the cervix and uterus, the fetus, the maternal pelvis or combinations of these factors. (Powers, passage, or passenger. What is missing?)
Although precise criteria for diagnosis have been established, clinically more general terms are often recorded. Failure to progress may refer to delays in dilation and/or descent.
A diagnosis of dystocia CANNOT be made until the active phase of labor and before an adequate trial of labor has been achieved.
A diagnosis of prolonged latent phase is not dystocia. Dystocia is not a diagnostic label.
Dystocia can result from abnormalities primarily involving the cervix and uterus, the fetus, the maternal pelvis or combinations of these factors. (Powers, passage, or passenger. What is missing?)
Although precise criteria for diagnosis have been established, clinically more general terms are often recorded. Failure to progress may refer to delays in dilation and/or descent.
A diagnosis of dystocia CANNOT be made until the active phase of labor and before an adequate trial of labor has been achieved.
A diagnosis of prolonged latent phase is not dystocia.
20. ACOG Diagnostic Criteria Protraction disorders occur when labor is slower than normal compared to labor norms for nulliparous and multiparous women.
Arrest disorders occur when there is complete cessation of progress in cervical dilatation or fetal descent. Protraction disorders occur when labor is slower than normal compared to labor norms for nulliparous and multiparous women.
Arrest disorders occur when there is complete cessation of progress in cervical dilatation or fetal descent.
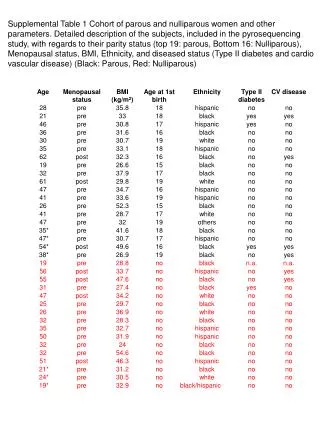
21. Are these criteria valid? Zhang, J., Troendle, J. F., & Yancey, M. K. (2002). Reassessing the labor curve in nulliparous women. American Journal of Obstetrics & Gynecology, 187, 824-828.
Sample: 1329 nulliparous women with a term, singleton, vertex fetus of normal birth weight after spontaneous onset of labor 1992-1996. Cesarean deliveries were excluded, n=1162. Sample: 65% non-Hispanic White
12% non-Hispanic Black
7% Hispanic
11% Asian
5% Other
48% Caudal/epidural & 50% oxytocin augmentation
13% low forceps/vacuum
Primarily resident managed L&D.Sample: 65% non-Hispanic White
12% non-Hispanic Black
7% Hispanic
11% Asian
5% Other
48% Caudal/epidural & 50% oxytocin augmentation
13% low forceps/vacuum
Primarily resident managed L&D.
22. Zhang et al.�s findings Medium labor admission to complete = 7.3 hrs (3.3 hrs 10th and 13.7 hrs 90th)
Transition from latent to active labor appears more gradual than the Friedman curve
No deceleration phase was observed
Median complete to birth = 53 minutes (18 min 10th and 138 min 90th) Additional findings:
4 to 10 cm = 5.5 hours average compared to 2.5 hrs under Friedman curve
Labor lasting for > 2 hrs without perceptible change in dilatation is NOT uncommon before 7 cm.
In many women, the rate of cervical change NEVER exceeds 1 cm/hr.
CONCLUSION:
Labor in nulliparous women progresses more slowly than the Friedman curve indicates.
This has been previously suggested in other studies in the 1980s and 1990s:
1. Albers, L., Schiff, M. Gorwoda, J. G. (1996). The length of active labor in normal pregnancies. Obstetrics & Gynecology, 86, 355-359.
CNM managed patients (total during 3 years was 2661), Restriction criteria n = 1513
Nulliparous women mean length of active phase was 7.7 hrs. (no ethnic differences) with 2 SD > of 19.4 hrs, second stage 53 minutes wotj 2 SD > of 147 minutes (Am Indians significantly shorter than non-Hispanic whites)
Sample, healthy, low risk, term with spont labor without oct or epidural.
2. Albers, L. L. (1999). The duration of labor in healthy women. Journal of Perinatology, 19. 114-110/
1996 data from 9 hospital CNM practices. Again healthy, term, vertex, spont labor without oct or epidural.
Nullip: 7.7 hr mean for 4 � complete (2 SD > 17.5hours), second stage = 54 min (2 SD 146)
Nullips > 30 yrs had longer SS but not active labor.
3. Kilpatrick, S. J., Laros, R. K. (1989). Characteristics of normal labor. Obstetrics & Gynecology, 74, 85-87.Additional findings:
4 to 10 cm = 5.5 hours average compared to 2.5 hrs under Friedman curve
Labor lasting for > 2 hrs without perceptible change in dilatation is NOT uncommon before 7 cm.
In many women, the rate of cervical change NEVER exceeds 1 cm/hr.
CONCLUSION:
Labor in nulliparous women progresses more slowly than the Friedman curve indicates.
This has been previously suggested in other studies in the 1980s and 1990s:
1. Albers, L., Schiff, M. Gorwoda, J. G. (1996). The length of active labor in normal pregnancies. Obstetrics & Gynecology, 86, 355-359.
CNM managed patients (total during 3 years was 2661), Restriction criteria n = 1513
Nulliparous women mean length of active phase was 7.7 hrs. (no ethnic differences) with 2 SD > of 19.4 hrs, second stage 53 minutes wotj 2 SD > of 147 minutes (Am Indians significantly shorter than non-Hispanic whites)
Sample, healthy, low risk, term with spont labor without oct or epidural.
2. Albers, L. L. (1999). The duration of labor in healthy women. Journal of Perinatology, 19. 114-110/
1996 data from 9 hospital CNM practices. Again healthy, term, vertex, spont labor without oct or epidural.
Nullip: 7.7 hr mean for 4 � complete (2 SD > 17.5hours), second stage = 54 min (2 SD 146)
Nullips > 30 yrs had longer SS but not active labor.
3. Kilpatrick, S. J., Laros, R. K. (1989). Characteristics of normal labor. Obstetrics & Gynecology, 74, 85-87.
23. Friedman (1955 & 1978) & Zhang et al. (2002) This illustrates the more gradual transition from latent to active labor.
Longer time from 4 to 10 cm. (5.5 vs 2.5 on average)
No deceleration phase observed. This illustrates the more gradual transition from latent to active labor.
Longer time from 4 to 10 cm. (5.5 vs 2.5 on average)
No deceleration phase observed.
24. Average dilatation & descent curves for nullips
25. Dystocia & Cesarean 50 � 70% of ALL cesareans can be attributed to this single diagnosis
The criteria for dystocia are NOT met in 16 � 30% of cases
In > 15% of cases, women were actually in latent labor when failure to progress was diagnosed
In 36% of cesareans for failure to progress after full dilatation, the second stage was NOT prolonged.
(Gifford et al, 2000). Gifford, D. S., Morton, S. C., Fiske, M., Keesey, J., Keeler, E., & Kahn, K. L. (2000). Lack of progress in labor as a reason for cesarean. Obstetrics & Gynecology, 95(4), 589-595.
AHCPR funded Management and Outcomes of Childbirth Patient Outcomes Research Team (PORT) by contract to RAND.
Sample drawn from women who delivered in 30 hospitals in Los Angeles County and Iowa.
Telephone survey of 733 women (para 0 or 1 only) who delivered full-term, nonbreech infants by unplanned cesarean section between 3/93 and 2/94
68% of unplanned c/s were for failure to progress
Gifford, D. S., Morton, S. C., Fiske, M., Keesey, J., Keeler, E., & Kahn, K. L. (2000). Lack of progress in labor as a reason for cesarean. Obstetrics & Gynecology, 95(4), 589-595.
AHCPR funded Management and Outcomes of Childbirth Patient Outcomes Research Team (PORT) by contract to RAND.
Sample drawn from women who delivered in 30 hospitals in Los Angeles County and Iowa.
Telephone survey of 733 women (para 0 or 1 only) who delivered full-term, nonbreech infants by unplanned cesarean section between 3/93 and 2/94
68% of unplanned c/s were for failure to progress
26. Reasons for Dystocia in Healthy Nulliparous Women Clinical decision-making
Inherent labor �inefficiency�
Aging of nulliparous population
Genetic factors
Anthropomorphic characteristics
Fetal factors
Psychophysiologic factors
Labor management and care practices
27. Reasons for Dystocia in Healthy Nulliparous Women Clinical decision-making leading to questionable diagnoses
What are the parameters of normal labor?
As described a bit earlier, in a 2000 report by Gifford, in 16-30% of cesarean sections performed for the indication of �dystocia�, diagnostic criteria were not met.
In more than 15% of the cases women were actually in latent labor when failure to progress was diagnosed.
A June 2004 report by Kalish et al. in Ob/Gyn, showed that a phenomenon of elective cesarean section during labor is emerging. In 13% of 422 cases of cesarean delivery the physician OFFERED cesarean section before a clear medical indication had occurred. And in another 8.8% the woman requested cesarean section during laobr. Women who were unmarried or undergoing induction were LESS likely to request cesarean delivery.
Do we now have a new clinical entity: Intrapartum elective cesarean section? As described a bit earlier, in a 2000 report by Gifford, in 16-30% of cesarean sections performed for the indication of �dystocia�, diagnostic criteria were not met.
In more than 15% of the cases women were actually in latent labor when failure to progress was diagnosed.
A June 2004 report by Kalish et al. in Ob/Gyn, showed that a phenomenon of elective cesarean section during labor is emerging. In 13% of 422 cases of cesarean delivery the physician OFFERED cesarean section before a clear medical indication had occurred. And in another 8.8% the woman requested cesarean section during laobr. Women who were unmarried or undergoing induction were LESS likely to request cesarean delivery.
Do we now have a new clinical entity: Intrapartum elective cesarean section?
28. Labor �inefficiency� Labor is on average longer in the nulliparous woman
Influence of the �active management� protocol on the concept of uterine function
Is the nulliparous uterus by nature �inefficient�? Or is its activity simply different?
29. Active Management 1970s Dublin Maternity Hospital
Specifically developed for & restricted to first-time mothers
Basic premise:aggressive response to the early correction of myometrial dysfunction ineffective in promoting cervical dilatation according to pre-set criteria
30. Components of Active Management Strict criteria for admission in spontaneous labor
Early amniotomy
Early recognition of dystocia
Intravenous pitocin administration for dystocia
Midwifery care
31. Dublin Results Total length of labor kept under 12 hours for the majority of nulliparous women
Cesarean section rate remained low at just over 5%
Operative vaginal births remained at 19%
(O�Driscoll et al., 1973)
32. Subsequent reviews re: Active Management Only a modest effect on cesarean section and the primary ingredient is supportive care rather than medical intervention (Thornton & Lilford, 1994).
Meta-analysis concluded that active management is associated with a 34% decrease in the rate of cesarean delivery for dystocia in nulliparas (Glantz & McNanley, 1997).
Thornton, J. G. & Lilford, R. J. (1994). Active management of labour: current knowledge and research issues. BMJ, 309, 366-369.
There had been NO RCT�s on the total package of active management or of the use of strict diagnostic criteria alone.
Findings of trials of early amniotomy (n=6), early oxytocin (n=4) and these 2 combined (n=3) did not suggest that these interventions are effective in reducing rates of c/sec or operative vaginal delivery.
In contrast, the provision of continuous support seems to reduce both types of operative delivery.
Glantz & McNanley (1997).
18 studies identified, only 5 met criteria for tenets of active management followed, detailed description of patient selection and analysis, numerical data on cesarean deliveries for dystocia in nulliparas, and use of a control group.
There is no Cochrane Review on �Active Management�. Why?
Lack of consistency in application of the protocol, e.g. active management in one study is NOT the same as active management in another study
Majority of the studies are observational not experimental
Sadler, Davidson & McCowan (2001) in Birth
An Australian RCT of active management (651 nulliparous women randomized), there was no difference in satisfaction with labor care between groups.
In the U.S., there has been widespread adoption of components of the active management protocol, particularly amniotomy and aggressive use of pitocin with the reverse trend observed in our cesarean section rate for first-time mothers.
A new study from Dublin was recently published:
A 2004 report in AJOG, retrospectively review the outcomes for 34,201 nulliparous women who delivered at the Dublin National Maternity Hospital between 1989 and 2000. For healthy nulliparous women at term with singleton pregnancies in a cephalic presentation in spontaneous labor, the cesarean section rate increased from 2.4%, but remained stable at an average of 5% since 1992. HOWEVER, THE PERCENTAGE OF THESE WOMEN IN SPONTANEOUS LABOR FELL FROM 83% TO ONLY 60% IN THE 11 YEARS BETWEEN 1989 AND 2000.
The overall nulliparous cesarean section rate rose from 8.1% to 16.6%.
The cesarean birth rate among nulliparous women with induced labor increased almost 3-fold: 8.0 to 21.9%
The cesarean birth rate pre-labor increased 6-fold from 1.0% to 3.7%.
Perinatal mortality fell significantly among nulliparous women during the 12-year period, however ONLY WHEN INFANTS <37 WEEKS GESTATION were included in the outcomes. For nulliparous women 37 weeks and beyond, increased rates of intervention including induction of labor and pre-labor cesarean section were not linked to improvements in perinatal mortality.
Foley et al. (2004). The continuing effectiveness of active management of first labor, despite a doubling in overall nulliparous cesarean delivery. American Journal of Obsetetrics & Gynecology, 191, 891-895.
33. Other potential causes of dystocia in nulliparas Maternal age
Genetics
Maternal anthropomorphic characteristics
Fetal factors
Psychophysiologic factors
Labor environment and care practices
34. Maternal Age Nulliparas > 35 yrs experience cesarean at twice the rate
Dystocia is the cause at 30 � 200% higher rate
Nulliparas > 35 are more likely to be white, married & have private insurance
#1. Adashek, Peaceman, Lopez-Zeno, Minogue & Socol, 1993.
#2. Bobrowski & Bottoms, 1995; Prysak, Lorenz & Kisly, 1995; Main, Main & Moore, 2000#1. Adashek, Peaceman, Lopez-Zeno, Minogue & Socol, 1993.
#2. Bobrowski & Bottoms, 1995; Prysak, Lorenz & Kisly, 1995; Main, Main & Moore, 2000
35. Average age at first birth Mean age at first birth in the U.S.
21.4 years in 1970
24.6 years in 2000
25.1 years in 2002 There is no question that, as a group, nulliparous women are older than they were 30 years ago, but the question is,
�What effect does this age increase have on the incidence of dystocia and cesarean section?� There is no question that, as a group, nulliparous women are older than they were 30 years ago, but the question is,
�What effect does this age increase have on the incidence of dystocia and cesarean section?�
36. Maternal Age Ecker et al, 2001 & Main et al., 2000:
Two large nulliparous cohorts with women grouped in 5-yr age brackets
Incidences of FTP, fetal distress, and c/sec during labor increased progressively after age 25, with large increases after 35 and 40
37. Maternal Age Do these observations point to a progressive, age-related deterioration in myometrial function?
and/or
Are other maternal characteristics and provider behaviors functioning?
38. Genetics Potential genetic mechanism of inefficient uterine action
Sweden: Berg-Lekas, Hogberg & Winkvist, 1998
Utah: Varner, Fraser, Hunter, Corneli, & Ward, 1996 Swedish Study:
Nulliparous daughter of mother who experienced dystocia was at a 1.7X greater risk (1.2-2.4 CI); dystocia with operative delivery risk 1.8 (1.0 � 3.1)
Younger sibling of an older sister who experienced dystocia was at a 2X greater risk (1.5-2.7 CI); dystocia with operative delivery risk 3.5 (2.1 � 5.8)
Twin sister of a twin who experienced dystocia was at a 24X greater risk (1.5-794.5 CI)
Incidence of dystocia 2.2% in parental cohort & 12.5% in daughter cohort (chances in diagnostic classification)
Utah study:
Daughters of mothers with c/sec were 1.4 X great risk of c/sec (1.18 � 1.70)
Another potential mechanism: Psychology of the self-fulfilling prophecy.
Swedish Study:
Nulliparous daughter of mother who experienced dystocia was at a 1.7X greater risk (1.2-2.4 CI); dystocia with operative delivery risk 1.8 (1.0 � 3.1)
Younger sibling of an older sister who experienced dystocia was at a 2X greater risk (1.5-2.7 CI); dystocia with operative delivery risk 3.5 (2.1 � 5.8)
Twin sister of a twin who experienced dystocia was at a 24X greater risk (1.5-794.5 CI)
Incidence of dystocia 2.2% in parental cohort & 12.5% in daughter cohort (chances in diagnostic classification)
Utah study:
Daughters of mothers with c/sec were 1.4 X great risk of c/sec (1.18 � 1.70)
Another potential mechanism: Psychology of the self-fulfilling prophecy.
39. Anthropomorphic Characteristics Short-stature, particularly < 150 cm.
Maternal overweight (BMI > 26) and obesity (BMI > 29) prior to pregnancy
Pregnancy weight gain in excess of 35 � 40 pounds
Key is that the incidences of overweight, obesity and high pregnancy weight gain are increasing in the U.S.
40. Fetal factors Fetal weight and C/sec rate
< 20% with birth weight < 4000 g
> 30% at 4000 � 4499 g
60% at > 4500 g
Persistent occipitoposterior position
Occurrence of 2.4 � 7.2% in nulliparas
2 to 3-fold increase in operative delivery
3 to 4-fold increase in cesarean section
Unengaged head at labor onset 2002 report of over 8,000 low-risk first pregnancies (Mulik, Usha, Kiran, Bethal, & Bhal, 2002)
8% of newborns had birthweight 4000 � 4499 g
1% were > 4500 g
Persistent OP (Fitzpatrick, McQuillan, & O'Herlihy, 2001; Ponkey, Cohen, Heffner, & Lieberman, 2003; Sizer & Nirmal, 2000)
Unengaged head at labor onset (Roshanfekr, Blakemore, Lee, Hueppchen & Witter, 1999)
Associated with a 3-fold increase in the rate of cesarean
This relationship persisted at 50% when fetal weight was controlled2002 report of over 8,000 low-risk first pregnancies (Mulik, Usha, Kiran, Bethal, & Bhal, 2002)
8% of newborns had birthweight 4000 � 4499 g
1% were > 4500 g
Persistent OP (Fitzpatrick, McQuillan, & O'Herlihy, 2001; Ponkey, Cohen, Heffner, & Lieberman, 2003; Sizer & Nirmal, 2000)
Unengaged head at labor onset (Roshanfekr, Blakemore, Lee, Hueppchen & Witter, 1999)
Associated with a 3-fold increase in the rate of cesarean
This relationship persisted at 50% when fetal weight was controlled
41. Reasons for Dystocia in Healthy Nulliparous Women Clinical decision-making leading to inaccurate diagnosis
Inherent �inefficiency� of nulliparous labor
42. Maternal Psychophysiology & Dystocia: The Stress Response Fears of childbirth in pregnancy negatively correlated with uterine function in Montevideo units; anxiety and EPI during labor and length of labor
NEP & EPI rise significantly and independently during labor
EPI positively correlated with state anxiety and to total length of labor
EPI negatively correlated with uterine function. Lederman�s study of 32 healthy nulliparous women
Montevideo Units =
3-5 cm:
EPI with anxiety = .60, p < .01; cortisol & anxiety = .59
EPI with length of labor = check this value; cortisol & LOL not related
EPI with Montevideo units = -.71, p < .01: cortisol & MVU = -.55
NEP was unrelated to EPI, cortisol, anxiety, LOL
Alehagen, Wijma, Lundberg, Melin & Wijma, 2001 confirmed patterns of catechol and cortisol increases from late pregnancy to labor, N=50 nulliparous Swedish women.
EPI and Cortisol are much more reflective of mental stress rather than physical stress; EPI falls more dramatically after effective epidural. Lederman�s study of 32 healthy nulliparous women
Montevideo Units =
3-5 cm:
EPI with anxiety = .60, p < .01; cortisol & anxiety = .59
EPI with length of labor = check this value; cortisol & LOL not related
EPI with Montevideo units = -.71, p < .01: cortisol & MVU = -.55
NEP was unrelated to EPI, cortisol, anxiety, LOL
Alehagen, Wijma, Lundberg, Melin & Wijma, 2001 confirmed patterns of catechol and cortisol increases from late pregnancy to labor, N=50 nulliparous Swedish women.
EPI and Cortisol are much more reflective of mental stress rather than physical stress; EPI falls more dramatically after effective epidural.
43. Catecholamines & uterine function Human myometrium richly supplied with beta-adrenergic receptors
High levels of EPI (or other beta-sympathomimetic agents) stimulate these receptors and decrease uterine contractility
Chronic stress, stress responsivity, acute stress & dystocia
Coping and situation-specific psychological attributes
44. Environment & Dystocia Location of birth
Provider characteristics
Care practices
Continuous supportive care
45. Care Practices & dystocia Admission to hospital
Induction of labor
Epidural analgesia
Maternal nutrition SUPPORTIVE CARE
Information
Comfort measures
Coping strategies
Advocacy
Techniques to support physiologic labor
46. Questions about Dystocia Is there an epidemic of social intolerance for labor? (Is FTP really FTT?)
Do we need new norms for the progress of labor for older first-time mothers? For women who are overweight or obese?
Are the boundaries of dystocia becoming blurred so that clinical decision-making is affected?
47. Questions about Dystocia Is the social acceptability of cesarean section making the concept of dystocia an archaic discussion?
Will national goals to reduce cesarean section rates persist beyond 2010?
48. ? Individual Dystocia Risk ?
49. What is needed to stop the epidemic? A re-examination of labor norms and diagnostic criteria for dystocia for first-time mothers
A social reconstruction of the process and experience of childbirth
50. What is needed to stop the epidemic? A revolution in the acute care system of care for birthing women
Application of the midwifery model of care as the standard of care for all healthy women