Download
1 / 26
260 likes | 484 Views
Tourism Statistics Report Greenland 2018. Table of Contents. Executive Summary page 3 Introduction page 4 Flight Passenger Statistics Flight Passenger Statistics page 5 Accommodation Statistics Accommodation Statistics – Number of Overnight Stays 2018 vs 2017 page 6

E N D
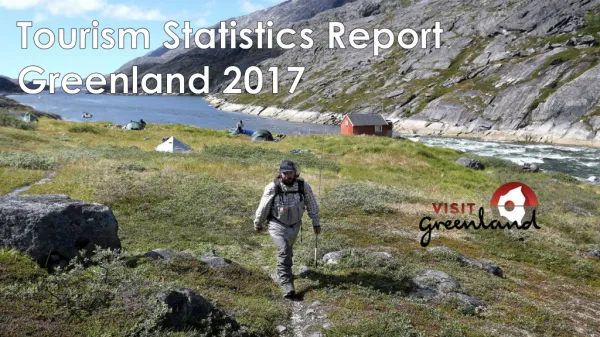
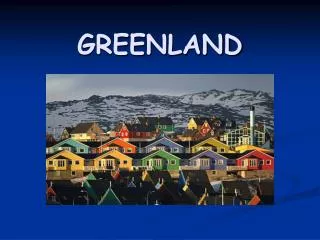
Tourism Statistics Report Greenland 2018
Table of Contents Executive Summary page 3 Introduction page 4 Flight Passenger Statistics Flight Passenger Statistics page 5 Accommodation Statistics Accommodation Statistics – Number of Overnight Stays 2018 vs 2017 page 6 Number of Tourist Overnight Stays in the Regions 2018 vs 2017 page 7 Number of Tourist Overnight Stays in the Years 2008-2018 page 8 • Number of Tourist Overnight Stays – Season Trends 2009-2018 page 9 Number of Guests 2018 vs 2017 page 10 Number of International Guests in the Regions 2018 vs 2017 page 11 Number of International Guests in the Years 2008-2018 page 12 • Number of International Guests – Season Trends 2009-2018 page 13 Cruise statistics Cruise guests 2008-2018page 14 No. of port calls according to capacity page 15 No. of cruise guests per region page 16 16 largest cruise segments page 17 Statements on the 2018 Season By Tourism Operators in Greenland page 18 Passengers on Air Iceland Connect Routes page 19 Foreign plane passengers + cruise passengers page 20 Towards More Tourism page 21 5 Big Market Surveys in Key Markets page 22 Global Trends for Adventure Tourism page 23-24 • The New Strategy Period 2020-2023 page 25 Final Thoughts page 26
Executive Summary • After the 2-year period from 2015-2017 with a general tourism growth of approximately 10%, the growth in 2018 is approximately 3% for the land based tourism if one takes a starting point in the growth in the number of international flight passengers. On the other hand there was a significant increase in cruise tourism of 19.8% from 2017 to 2018. • This version 2 of the tourism statistics report included cruise statistics, which were published on stat.gl on the 27th of August after a delay caused by some late submissions of port call registrations. • Incomplete data in relation to flight passengers, accommodations and cruise still pose a huge challenge. • The -4.7% decline in the number of international guests in the accommodations is also indicative of an increased number of overnight stays under open sky, in private homes or in accommodations that do not submit registrations. On the other hand more international guests in the accommodation that register the guests have, on average, bought slightly more overnight stays per accommodation (from average of 2.5 in 2017 to 2.7 in 2018). The number of international overnight stays has, in general, been largely unchanged with a growth of 0.1%. • At the Towards More Tourism conference in November 2018 the tourism industry came up with 11 recommendations on a responsible and sustainable development of the tourism (see vg.gl/11anb), out of which the effort to establish a more even season development – and thus a more financially sustainable industry – was one of them. • Overnight stay data on 2018 unfortunately shows a development that no longer points towards more even seasons. It will likely demand a prolonged, strategic and united effort to even out the steep summer season trend. • As regards to the wish for a responsible tourism development from a financial, social and environmental perspective, it is important that Greenland, which is already distinctly an adventure destination, from now on continues to focus on adventure tourism, which gives a far better offset for revenue in the local communities. It is not without reason that this form of tourism is the fastest growing kind of tourism in the world, according to Adventure Travel Trade Association in part due to the global focus on sustainability manifested in the work of several countries to meet the UN 17 Sustainable Development Goals (SDG’s). Sustainable adventure tourism has a section of its own in this report coupled with topics that were covered at the TMT2018 conference. • As the airport bill has been passed and there is a goal of building 3 new airports by 2023 it is important that the new strategy period from 2020-2023 is used to cooperate with the industry and the public sector to look at what framework conditions and areas need to be taken care of first in order to be able to meet the expected ground breaking development that a significantly more accessible Greenland faces. Especially in regards to responsible and sustainable tourism as well as how we, going forward, measure tourism growth and the value tourism creates for Greenland.
Introduction StatisticsGreenland’s problems with obtaining cruise statistics for 2018 illustrate the general challenges in Greenland to obtaining valid tourismstatistics. In relation to accommodationovernights, it has been an issue for manyyearsthat the nationalities of over half of the overnights and guests in Sermersooq East are not registered. This cannotbeseen in the data for 2016, becauseStatistics Greenland thatyeardistributed the number of non-registeredguests to the region proportionallybetween the countriesregistered, based on the distribution of registerednights and guests in the region. Since 2017, the real number of unregistered guest nationalities has beenfeatured under the category ‘Unknown’. The registration of flightpassengers’ nationalities, whichbegan in July 2014, has alsobeenconsistentlyincomplete, with 26.9% of passengers’ nationalities not registered in 2014, 19.7% in 2015, 7.1% in 2016, 12.3% in 2017 and 7.6% in 2018. VG and Mittarfeqarfiit have agreed on a commongoal of registering at least 95% of flightpassengers’ nationalities, and joint effortsarebeing made to achievethis in 2019. In order to beable to compareoneyear with the next, VG uses the method of distributing ‘unknowns’ (i.e. non-registeredpassengernationalities) proportionallybetween the differentcountries of origin, on agreement with Statistics Greenland. With this in mind, all growth rates shouldbeaccepted with reservations, alsobecause the sample sizebeingworked with in a Greenlandiccontext, where a difference of just a couple of hundred tourists from year to year in a given segment cancreate large differences in growth rates, is small in a general statisticalcontext. In cooperation with the Department for Industry, Energy and Research, Statistics Greenland and Mittarfeqarfiit, thereare a number of initiatives, either in progress or beingdeveloped, whicharedesigned to improvetourismstatistics, althoughthis is considered to be a processthatwilltakesomeyears to fullyreachitsgoal. The followingsectionsrevieweach type of tourism-relatedstatistic for 2018 individually, starting with flightpassengers. This reportworksmainly with the numbers for the whole of Greenland combined, with a fewexceptions, but every region (whereAvannaata/Qeqertalikaremerged for reasons to do with the data series) is furtherreviewed in separate, smaller reports, whicharealsopublished on tourismstat.gl/analyses.
Flight Passenger Statistics • Although the share of registered flight passenger in 2018 only reached 92.4 % it is important to keep in mind that we in the data/chart below compare with data on 2017 where only 87.7 % were registered. Thus the results must be taken with reservations. The fact that the overall traffic increased by 3.1 % is, however, an indication that a 3.3 % growth in the tourist segment as whole seems plausible as data on the overall traffic is complete with a registration of 100 %. The category “Unknown” is distributed proportionally between the markets. As explained before the small samples lead to larger statistical uncertainty than large samples, as even minor changes in numbers can cause disproportionally big differences in growth percentage from year to year. Thus all growth percentages for country segments under 1,000 pax are marked in grey to signal that they must be taken with special reservations. The most significant positive results are the growth rates for the markets Germany (18.0 %), USA (23.1 %), France (26.8 %) and Great Britain (13.0 %). On the negative side especially China surprises with a decline of 28.8 %. As shown to the left in 2018 China was a larger source market than Great Britain, but in 2019 China is overtaken by the latter, as well as Canada, Norway and Iceland. There is, however, a risk that a larger group of Chinese passengers can have left the country by an unregistered departure, so one must keep that in mind. The general picture is largely positive, though with a more modest growth than the previous 2 years.
Accommodation Statistics – Number of Overnight Stays Sold As for the national overnight stays number, one must bear in mind that more than 50 % of the guests in Sermersooq East are not registered, and they consequently represent the largest source of error in the data. This is equivalent to, in a national perspective that 4.2 % of the overnight stays in 2017 and 4.9 % in 2018 were not registered. Growth rates for country segments with less than 1,000 overnight stays are marked in grey to signal that those growth rates must be taken with special reservations, as they are based on small samples. • In order to calculate the growth from year to year the amount of unregistered will, in agreement with Statistics Greenland, be distributed proportionally between the markets (according to how much each market represents in the amount of registered overnight stays). • Furthermore the reader must be aware that the data at hand represents 76 % of the total bed capacity in Greenland. • After finding good growth in the flight passenger data for the USA, Germany, France and Great Britain these trends can only partially be confirmed here, as Great Britain represents a decline of a staggering 31.1 % in the number of overnight stays. • The most likely explanation is the combination of sources of error from both the lack of flight passenger registrations and the lack of overnight stay registrations. • If this is not due to sources of error, it means that Brits in 2018 either stayed in Greenland for at shorter period of time or to a larger extent slept in open air, in private homes or in accommodations that do not submit registrations.
Number of Overnight Stays in the 5 Regions - 2018 vs. 2017 From the overall national number on the number of international overnight stays in 2018 vs 2017 we know that the growth is 0.1 %. But one must take this with big special reservations due to incomplete registrations, especially in Sermersooq East. The chart below therefore only shows numbers on tourist overnight stays for 4 out of the 5 regions there are data series available from on bank.stat.gl/tudhot (Avannaata/Qeqertalik are listed together to allow the tudhot data series to remain unbroken back to before the merging of the two). Out of the 4 regions only Qeqqata shows growth. As for Sermersooq East there is a 19.5 % growth in the number of total overnight stays. This indicates a likely growth in the tourist segment, but due to incomplete registrations this can unfortunately not be verified. It is thus a very mixed and unclear picture that accounts for the number of tourist overnight stays sold. • If one focuses solely on the overnight stay statistics there would appear to be status quo on a national level with a 0.1 % growth overall. It is however possible that a relatively big growth can be found in the data on Sermersooq East that can increase the national level close to 3.3 %, which is equivalent to the growth in number of tourists by airplane. Due to incomplete data on Sermersooq East there is no way to prove this thesis, and the number of guests (see p. 10) further weakens this assumption. The number of overnight stays sold, are a good indication of the revenue created in the accommodations. The number of guests does not need to follow the same development 1:1, as it can vary from year to year how many nights each guest have bought in each accommodation. However there should not be too big a difference between the two parameters.
Number of International Overnight Stays in Accommodations 2008-2018 Statistics Greenland has extracted a special data set for us, as Visit Greenland does not have access to raw data that can be attributed to specific accommodations. In the graph the green bars show the development in the total number of international (i.e. tourists) overnight stays over the last 10 years. With permission from Statistics Greenland VG has been allowed to extract data for a special control group (purple data set), which consists of the 9 largest hotels in order to determine the degree of correlation. There is a relatively good correlation between data, which points to an acceptable degree of validity in the registrations from the other accommodations, as the 9 largest hotels have consistently submitted complete registrations over the past 10 years. If there is a large discrepancy this could point to a certain amount of incorrect registrations in data from the other accommodations. As can be seen there is a smaller degree of fluctuations in the data on the 9 largest hotels, even in the recession period after the global financial crisis in 2008. That points to them being better equipped to meet the negative effects of the recession. They do, however, suffer loss in revenue from international overnight stays in 2018, where the other accommodations, based on data, appear to have experienced growth. 2017 represents the first time that tourist overnight stays from the 11 ’new’ accommodations (representing 8,351 extra international overnight stays in 2017), which only began registration in 2017 is included– thus the growth in the total sum between 2016 and 2017 is “artificially steep”, as is also indicated by the more stable level in the data of the 9 largest hotels. Most of the 11 ‘new’ accommodations have in reality been in business for several years leading up to 2017, so they do not represent a “genuine growth” between 2016 and 2017. That growth is in reality ‘invisibly fazed in’ over a longer period of time leading up to 2017. On the other hand data from 2017 and on are now more in line with reality. According to the inventory of VG in terms of the total bed capacity in Greenland per Q1 2019, registrations are submitted for at least 76 % of the total bed capacity.
Overnight Stay Statistics – Season Trends • Just as long as there has been registration in accommodations in Greenland there has been a clear season trend, which in one graph is similar to a “Mexican hat” with a significant high season June-July-August-September and just as significant a low season in November-December and January-February. As can be seen there has been growth in the later years, but is has primarily boosted the summer high season, and only to a smaller extent the other months. • One can, however, note that March-April in 2018 has seen a small increase, which hopefully can lead to better marketing of the spring season and its products. • As it is highlighted in the 11 recommendations (vg.gl/11anb) from the Towards More Tourism conference in November 2018, a more sustainable tourism industry will be the result if the ‘hat’ flattens more and bigger revenue will be created in the low and shoulder seasons. This can lead to more full-time employment in the industry and better the usage of the existing capacity in terms of hotel beds and flight seats. • In later years VG and Air Greenland have focused on promoting the winter season under the slogan “Winter is only the beginning” and “Winter is hot” in order to open the eyes of the market to the attractive and obvious possibilities in the winter season. It is necessary with a stable and coordinated effort across the industry if it is to be reflected in the market.
Accommodation Statistics – Number of Individual Guests • The number of guests in the accommodations shines a light on the number of individuals that have purchased overnight stays in a given region – or as in the graph below – in Greenland as a whole. The graph shows a decline of 4.7 % in the number of international guests from 2017 to 2018 (incl. guests residing in DK). The difference of nearly 5 percentage points compared to the number of international overnight stays can be caused by a difference between how many nights each guest bought on average per accommodation. • If one divides the number of international overnight stays with the number of international guests one arrives at the average number of overnight stays a given tourist has purchased per accommodation. It was 2.5 in 2017 vs 2.7 in 2018. In the flight passenger data (p. 5) one notes a good growth in the key markets USA, Germany, France and Great Britain. Compared to the number of overnight stays (p. 6) USA, Germany and France all saw growth, whereas Great Britain saw a big decline. As for the number of guests (the graph on the left) the USA and France both saw good growth, whereas Germany experienced a moderate decline and Great Britain a large decline. As we once again are left with discrepancies between the different types of tourism data, incomplete data would appear the most likely main cause. Other reasons may be the small sample sizes combined with variation in terms of the number of nights the different segments have bought on average per accommodation – or variation in terms of choice of accommodation, out of which some are not registered (for instance small hotel apartments, Airbnb or private homes).
Number of International Guest in 4 of the 5 Regions - 2018 vs 2017 • The chart below shows the number of international guests (incl. guests residing in DK) according to region. Avannaata and Qeqertalik are still listed as one region in order not to break the longstanding data series at bank.stat.gl/tudhot where Avannaata/Qeqertalik combined were registered under the previous region Qaasuitsoq. The two regions are likely to be spun off in a new data series in a few years. As for Sermersooq East only the total number of guests is shown, as more than half of the guests there has not been registered by nationality, thus the data is not valid. There is growth in two (Qeqqata and Kujalleq) out of the 4 regions when it comes to the number of international guests. The largest deviation from previously looked at data is that Sermersooq East has seen a total decline in the growth of 6.3 %. This must be seen in connection with a 19.5 % growth in the total number of overnight stays. Thus there is a large discrepancy between the number of overnight stays and the number of guests. If there are no errors in the Sermersooq East data this means that there was a jump in the average number of overnight stays per guest from 3.4 in 2017 to 4.4 in 2018 which is a significant change compared with the development in the other regions over time. It may however be partially due to the fact that the number of one day tourists has decreased significantly compared with the number of tourists that purchase a longer stay in the region.
Number of International Guest in Accommodations 2008-2018 As was the case on p. 8, where the total number of international overnight stays in Greenland was compared with corresponding data from the 9 largest hotels as ‘control group’, we make the same comparison in terms of the number of international guests. Here there is also a relatively good degree of correlation between the two data sets, which points to an acceptable degree of validity in the data on the other accommodations (than the control group). The other accommodations suffered a larger loss in revenue following the global financial crisis than the 9 largest hotels. In turn the 9 largest hotels saw a larger decline from 2017 to 2018, where the other accommodations experienced status quo. NB: Between 2016 and 2017 11 ‘new’ accommodations opened and they began to submit registrations, which causes an ‘artificial’ growth between 2016 and 2017 the equivalent of approximately 2,772 international guests. As can be seen, the control group represents approximately half of the international guests in the 10 year period and in 2016 even more than half. There are quite a few hotel projects in the making especially in IIlulissat and Nuuk, which is a logical consequence of the approval of the airport package. There are however also gradually created more and more small and midsize accommodations by the coast in later years, which is positive. According to the 11 recommendations from TMT2018 a sustainable tourism industry is not only about season expansion, but also about distributing the tourists all over Greenland, so it is not only the large destinations that are developed. Though accessibility in terms of the coming airport structure mainly favours the 3 airport cities, it will potentially also have a positive effect on other destinations, which will then be accessible with fewer stopovers from cities such as Copenhagen and Reykjavik (as well as in the future even more bigger hubs). For instance destinations such as Uummannaq, Qeqertarsuaq, Paamiut, Nanortalik and the like will obtain an easier one-day connection, which can make a big difference for tourists on shorter holidays.
Number of Guests – Season Trends 2009-2018 • When one looks at the season trends for the data type number of guests it is very similar to the graph on the data type number of overnight stays, which is to be expected. Comparing 2018 with 2017, 2017 had a slightly “flatter” season development that is more sustainable in terms of the potential for fulltime employment, bed capacity and flight seats. The 11 recommendations from Towards More Tourism about among other things season extensions speak for an increased effort to secure a better use of the capacity in the low and shoulder seasons. In a 10 year perspective it can be noted that the ”Mexican hat” in the beginning of the period from 2009-2018 was flatter and in time has reached a higher peak in the summer season which is indicative of destinations with a high degree of season trends. • Overnight stay data from Iceland shows that in the last few years there has been a more even season balance. There are still markets (e.g. Germany) that show a pattern of primarily summer visits, but in later years especially Great Britain has shown the opposite pattern, as they tend to mainly visit Iceland during the winter. One of the explanations for this fact can be found in cheaper air fares and hotel beds in the “off-season”. At the same time Iceland has managed to turn the winter into an attractive product via a focus on northern lights and a wide variety of winter activities as a result of a targeted effort in the low and shoulder seasons. This, of course, requires both resources for product development, marketing and good offers in the off-season in order to succeed in balancing the seasons and this process is likely to take some years.
Cruise Tourism – Number of Guests 2008-2018 On the 27th of august 2019 Statistics Greenland published the cruise statistics on 2018. It had been delayed among other things due to some overdue port call registration submissions. On the same say the numbers on 2017 were published on bank.stat.gl/tudkrp. The new numbers (the graph below) shows a significant increase in the number of passengers in both 2017 and 2018, the equivalent of 57.5% from 2016 to 2017, and 19.8% growth 2017 to 2018. The numbers on 2015 and 2016 are, however, still being revised and are expected to be adjusted upwards. No matter what 2015 and 2016 will be adjusted upwards to an extent that makes us able to conclude that the years from 2014 to 2018 saw a growth of 126%, a rather significant development in only 4 years. On the 1st of January 2016 a new port fee structure was implemented meaning that instead of being charged 525 DKK once per passenger, each port call is settled with a cruise fee of 1.1 DKK per gross tonnage. • In 2015 a ship of 2.100 pax and 69.203 gross tonnage would be charged 1.102.500 DKK (2.100 x 525 DKK) to call just once on a Greenlandic port. • Since the 1st of January 2016 the same ship has only had to pay 76.123 DKK (69.203 gross tonnage x 1,1 DKK x 1 port call) for a single port call – a saving of a staggering 93%. • Even with 4 port calls the ship would still only have to pay a fee of 304.493 DKK (69.203 x 1,1 x 4). • A smaller expedition ship with a capacity of 54 pax and a gross tonnage of 1,753 in 2015 would have to pay 28,350 DKK regardless of the number of port calls. From the 1st of January 2016 the same ship would be charged 7,713 DKK for 4 port calls. The strategy of changing the port fees in order to make Greenland more attractive as a destination for the cruise lines seems to have had a stimulating effect – with a one year delay. This makes perfect sense, at the cruise lines plan 1-2 years ahead.
Cruise Tourism – Number of Port Calls According to Passenger Capacity Based on the call list (vg.gl/call-list) the graph below shows how many port calls were made in each of the so called ”pax classes” (size classes according to passenger capacity). In general, from 2015 to 2018 there has been an overall increase in the number of port calls in the 3 largest pax classes, the largest increase being in the 251-500 pax class from 81 port calls in 2015 to 133 port calls in 2018. The smallest pax class (called “expedition cruise ships”) has seen a minor decline over the 4 years, from 191 to 186 port calls. • On must take into account that there may be a small number of changes in the call lists that have not yet been updated, as several parties are involved in the update. The total number of port calls from 2015-2018 were: • 2015: 327 port calls (7 of them in uninhabited locations) • 2016: 321 port calls (9 of them in uninhabited locations) • 2017: 304 port calls (15 of them in uninhabited locations) • 2018: 409 port calls (19 of them in uninhabited locations) • When the total number of passengers has increased significantly in 2017 and 2018 it is linked to the fact that the share of large ships has increased. The number of ships in the 1200+ pax class in 2016 were 7 in 2018 the number had more than doubled to 16. • As mentioned on the previous page the large growth in the cruise tourism is likely closely related to the new fee structure implemented on the 1st of January 2016, which affords great savings especially for ships with a large passenger capacity.
Cruise Tourism – Number of Guests per Region The number of passengers that visit each region can vary a great deal, both due to the frequency of port calls, but especially because of the size of the ships that call on Greenland. The graph below shows a significant difference in the number of passengers visiting Kujalleq and Sermersooq East. This is in part due to the fact that Kujalleq is the only region in 2018 to be visited by AIDAdiva (2.050 pax), AIDAluna (2.100 pax), AIDAvita (1.266 pax), Sea Princess (1.950 pax) and Serenade of the Seas (2.490 pax). AIDAcara (1.180 pax) also visited Qaqortoq 3 times in 2018 in connection with cruises including Nuuk and Ilulissat. The decline in the total number of passengers in Sermersooq East is primarily due to the decline in the number of large cruise ships, while there has been an increase in the number of port calls in the smallest 1-250 pax class, which one can observe in the regional report on Sermersooq East. It may be an indication of a new trend in Region East, but it too early to say at this time. All ships in Ittoqqortoormiit and Constable Pynt in 2018 were AECO members. As AECO demands its members to adhere to a number of guide lines for sustainability, the development in 2018 might be even better from a sustainability point of view. It should be noted that each passenger on average visits 2 or 3 regions over the course of a typical Greenland cruise. That there is growth in Qeqqata and Kujalleq, but not in the remaining 3 regions is likely due to natural variations in the time tables of the cruise lines from year to year.
Cruise Tourism – Number of Guests in the 16 Largest Segments As the cruise fees were changed with effect from the 1st of January 2016, a registration of cruise guests according to nationality was implemented. This means that 26 countries and “Other Countries” and “Other Europe” are registered – the same countries and areas have been registered according to guests in accommodations and flight passengers since the 1st of January 2016. Below is the number of guests in the 16 largest segments in 2017 and 2018. The Top 3 Germany, USA and Great Britain had a combined market share of 68.6% in 2018, and all experienced growth from 2017 to 2018 (DE: 32.4%, USA: 14.9%, GB: 11.5%). Australia saw a growth from 2017 to 2018 of a staggering 189.7% and in 2018 reached a market share of 8.1%. Canada, France and Switzerland as number 5, 6 and 7 only experienced a very modest growth from 2017 to 2018. As mentioned on page 15 there were 304 port calls in 2017 growing to 409 in 2018. So far 423 port calls have been announced for 2019. This number is likely to change slightly during 2019 due to changes in the cruise lines timetables due to the weather, but all points to a continued significant growth in cruise tourism in Greenland. Currently far more exchanges happen in Kangerlussuaq, but as Air Greenland only expects to regularly fly CPH-Nuuk and CPH-Ilulissat directly, when the airports are ready around 2023, the current role of Kangerlussuaqs as a cruise exchange airport will likely go to Nuuk and Ilulissat instead, unless Kangerlussuaq remains open for charter flights. At present there are hardly any exchanges out of Narsarsuaq, so the coming status of Narsarsuaqs as a heliport is not likely to cause significant changes in the sailing pattern in South Greenland.
Statements By Tourism Operators in Greenland I the past year Visit Greenland conducted two short surveys among tourism operators in Greenland. The first in March 2018 looked into how the 2017 tourist season has been as well as the expectations of the respondents to the 2018 season. 83 respondents answered. The second time was in November 2018, and the survey asked four questions on how the 2018 season had been so far and what could be the possible reasons for this. 64 respondents answered that survey. Below in green colour the expectations to the 2018 season can be seen as they were answered in March 2018. In blue colour one can see the answers from the November survey on how the season had progressed thus far. In March there were positive expectations to the 2018 tourist season, but in November it can be noted that the season progressed slightly less positive than expected. If the flight passenger statistics with a growth of approximately 3 % is precise this corresponds well with the answers from November 2018 – i.e. a combined more modest growth than the previous 2 years. The March survey was sent to 230 Greenlandic tourism operators out of which 64 answered most questions and 49 answered the entire questionnaire. In the end of 2019 VG will once again ask the tourism operators about the 2019 season along with other relevant questions to further qualify the tourism statistics from Statistics Greenland. The results of the survey must be taken with the following reservations: a) Complete answers from only 49 out of the approximately 260 tourism operators. b) Those that take the time to answer an online survey are often operators with a special flair for online technology c) These operators are likely better at answering emails in general. Both b and c represent skills that provide market advantages.
Air Iceland Connect Routes • The years from 2014 to 2016 saw a good growth on Iceland Connect routes between Iceland and Greenland, but since 2017 the development in the tourist segment has been in decline. Several tourist operators in Greenland that Visit Greenland has spoken to believe this is due to higher prices. An Air Iceland Connect ticket between Reykjavik and Kulusuk or Nuuk in the middle of July is approximately 400 € (about 3,000 DKK) for a one-way ticket, while a one-way ticket to Ilulissat in the middle of July can be as much as 901 € (about 6,700 DKK). As the prices vary a lot from day to day, it is difficult to say how the prices in general have developed in recent years, but higher ticket prices tend to put a damper on demand. An Air Greenland one-way ticket Keflavik-Nuuk in July can be as little as 2,756 DKK and up to 7,100 DKK. Another factor can be a beginning decline in the demand for Iceland as a destination which the overnight stay data from Iceland (below right) indicates.
Distribution of Tourists – International Flight Passengers and Cruise Passengers Since we began the registration of flight passengers according to country of residence in July 2018 we have been able to discern between tourists – meaning all passengers that do not reside in Greenland – and Greenlandic citizens. However, after four full years of registrations, we have yet to see a year with complete registrations. In 2015 19.7% of the passengers were not registered, thus they ended up in the category “Unknown”. Corresponding figures for the following three years are: 2016: 7.1% “Unknown”. 2017: 12.3% “Unknown”. 2018: 7.6% “Unknown”. To get a more realistic estimate of the number of tourists, Visit Greenland and Statistics Greenland have decided to distribute the category “Unknown” proportionally between the countries of residence registered for. Once this distribution is complete, one reaches the best possible estimate of the number of “international flight passengers” incl. Passengers residing in Denmark, who according to the definition of UNWTO (“...activities of persons traveling to and staying in places outside their usual environment for not more than one consecutive year for leisure, business and other purposes") all are to be considered tourists. The graph to the right shows the number of international flight passengers as well as the number of cruise passengers in Greenland from 2015-2018, the grey column representing the two figures combined in a given year. Approximately 10% of the flight passengers were going home from a cruise, but have usually bought a tour product ashore in connection with the change to air transportation and have thus acted both as a cruise tourist and as a land-based tourist. NOTE: Since the 2017 report Statistics Greenland has adjusted the number of cruise passengers in 2017 upwards. The 2015 and 2016 numbers are currently being revised.
Towards More Tourism 2018 – 11 Recommendations • From the 5th to the 8th of November 2018 Visit Greenland hosted the Towards More Tourism conference in Nuuk, with participation of tourism operators from all over Greenland and representatives from the 6 tourism regions (Avannaata, Qeqertalik, Arctic Circle, Sermersooq West, Kujataa and Sermersooq East). The conference offered keynote presentations and different types of workshops and not least networking events. This marked the first time in many years that the tourism industry came together, and the feedback has generally been positive in terms of what the participants have gained from attending the conference. • One of the main purposes was to formulate a number of joint recommendations for the tourism industry in terms of future challenges and opportunities, especially with regard to the expected increase in tourism following the establishment of the 3 new airports. • The result was the following 11 recommendations: • A strong and cohesive strategy for the tourism development • Season expansion – the distribution of tourism over time and place • Increased innovation and entrepreneurship • Sustainability,; nature and culture • Certification of tourism operators – quality and safety • Securing a workforce for the tourism industry • Competence development and education • Infrastructure – besides airports/heliports; harbour tourist receiving conditions, roads, trails, attractions, signs, toilets, souvenirs etc. • Digital services for tourists • The creation/strengthening of the regional tourist receiving infrastructure and marketing organizations • Branding and marketing • The complete recommendations can be read at vg.gl/11anb. It is very positive that the tourism industry as a whole can join together to define and prioritize which key areas are the most important to focus on. If the industry is to have the best possible prerequisites ahead of the establishment of the new airports it is especially important with coordination on a regional level, which is a process that will in effect be driven primarily by the municipalities and the regional destination companies– especially in close collaboration with the tourism operators. • There is continually a big need to maintain a dialogue with the tourism industry and it is currently looked into when the Towards more Tourism conference might return.
5 Large Market Surveys 2016-2018 • In collaboration with NATA, Air Greenland and the research agency NIT Kiel Visit Greenland has in later years conducted large market surveys in the 5 key markets Scandinavia (DK, SE, NO), Germany, France, Great Britain and the USA with between 2,000 to 4,000 respondents in each market. • The respondents were asked a large number of questions in 7 areas we have sought to uncover, and which ultimately resulted in main conclusions and discussion points: • 1. The interest in travelling to remote adventure destinations (including Greenland) 2. The image of Greenland as a travel destination • 3. Product and experience preferences of potential Greenland tourists • 4. Socio-demographic profiles of the potential tourists • 5. The segmentation model of Visit Greenland applied to the respondents • 6. Reasons not to go to Greenland • 7. The competitive position for Greenland – benchmarking against closest competitors • 8. Main conclusions and discussion points • Overall the surveys confirm the basic assumptions of Visit Greenland about the key markets, but naturally there are new insights and surprises in individual areas, which makes it a good and exciting read for everyone in the Greenlandic tourism industry, e.g. for a time outside the high season, where one has the time to immerse oneself in knowledge about the markets. VG has summarized the analyses of the 5 large surveys. You can read them at vg.gl/5surveys. In the document one also finds links to each of the complete analyses compiled by NIT Kiel – with the exception of the latest (Scandinavia) which is covered by a time limited exclusive agreement with Air Greenland until the 22nd of August 2019, after which it will be available at vg.gl/skandinavien. • VG uses conclusions and findings in connection with the quantitative tourism data and statistics available through Statistics Greenland, our own surveys and conversations with the industry itself as well as data and knowledge sources directly from the markets and from large international surveys/research. • Furthermore VG has since been a part of an inter-Nordic tourism analysis collaboration via the work group Nordic Analytic Group, which functions on an ad hoc basis, but also has worked together to conduct a large market survey in China on the segment High Spending Free Individual Travelers (HiSpFITs). The survey was supported by the Nordic Council of Ministers with 500,000 DKK. That analysis is quite extensive and can be studies in detail at vg.gl/cn18, or one can read the shorter summary at vg.gl/cn18short. • It is highly recommended to view the analyses in connection with the VG segmentation model and our approach to working with communication for the segments which one can find at tourismstat.gl, where VG publishes all tourism relevant knowledge.
Global Trends In Adventure Tourism • As mentioned Greenland is a distinct adventure destination. Adventure tourism is characterized by as a minimum to contain the following 3 aspects: Physical activity, Nature experiences and Cultural experiences – as opposed to mass tourism that often focuses on big cities, shopping, beach, relaxation and a more superficial interaction with the locals. According to Adventure Tourism Travel Association (ATTA) adventure tourism accounts for more than 60 % of the revenue in the local communities, whereas by far the biggest share of the revenue in mass tourism goes to global travel agencies, hotel chains and cruise companies – and most of all in the large, classic destinations. • According to ATTA’s Adventure Travel Trends Snapshot 2018 the “hottest” activity these years is: • Followed by: • Overall one can, with the exception of ‘Safaris’, see a pattern that is about responsibility toward nature and culture, which is a trend likely brought on by an increased political focus and an increased media focus on responsibility and sustainability. The markets tend to align to the demand, so this points to a reality where the discussion about sustainability is not all talk – at least where adventure tourism is concerned. At the same time these trends offer a clear signal as to where one can improve one’s competitiveness. • According to the research agency Technavio (‘Global Adventure Tourism Market 2016-2020’ from 2015) Greenland is up against the following leading adventure destinations:
Global Trends In Adventure Tourism • Also according to Technavio’s ‘Global Adventure Tourism Market 2016-2020’ report (see previous page) adventure tourism is on its way toward half of the global tourism market: The graph to the left: Shows the estimated global growth in adventure tourism and this confirms that adventure tourism is the fastest growing tourism market in the world compared with the other global tourism markets. The graph to the right: The revenue in adventure tourism is also expected to increase significantly in the coming years (the blue bars represent trillions of $ globally) with an average annual growth of approximately 5 %.
The New Tourism Strategy Period 2020-2023 • The Ministry of Industry, Energy and Research is currently working on the national tourism strategy for the years 2020 to 2023, i.e. the period leading up to the construction of the new airports. All five municipalities in Greenland (KommuneqarfikSermersooq, AvannaataKommunia, KommuneQeqertalik, KommuneKujalleq and QeqqataKommunia) have been invited to provide input to the process, and the strategy will be published in the summer of 2019. The national tourism strategy will overall contain sections on: • New infrastructural framework • The establishment of a Visitor Centre • National attractions • Tourist receiving infrastructure and sustainability • Regional tourism strategies • Concessions • Framework conditions and legislation • Market development and visibility via Visit Greenland • Visit Greenland will also subsequently publish the organization’s own strategy for the period, which covers the five core tasks/areas of action: • Market development • Visibility • Season extension • Accessibility and framework conditions • Statistics and documentation • The role of Visit Greenland in the Greenlandic tourism development is described in the statutes of the company: • “The purpose of the company is to serve as Greenland’s national knowledge centre for tourism, to work to brand and promote Greenland as a tourist destination and to work to promote and develop the tourism industry and tourism activities in Greenland. The purpose of the company is furthermore to promote and develop the experience and artisanal industries.” • In the coming strategy period Visit Greenland will continue to attract adventure tourism to Greenland, which offers the biggest possible local revenue and is the tourism type that is the most considerate of nature and respects the culture. • For Visit Greenland adventure tourism means that a destination: • Creates experiences that focus on active participation • Offers many levels of engagement and activity • Creates immersion in the destination via nature and culture • Products which make the guests feel like pioneers by challenging boundaries either culturally, intellectually or physically. • For Visit Greenland responsible tourism means that one: • Involves the local community in order to generate the most local economic benefits • Contributes positively to the preservation of nature and cultural heritage • Minimizes the negative environmental and social impact • Offers experiences which create an understanding of the local community and culture • Creates a connection between local tourism operators and international travel agencies about adventure tourism • Visit Greenland has created tools for the industry in order for operators to know the segments of tourists that travel to Greenland and how we can attract more. All of these tools are available for use and free of charge for the industry. See which segments your business caters to at www.tourismstat.gl and learn more about the tools you can use in your business at http://corporate.greenland.com/da/redskaber/.
Final Thoughts • If a growth of approx. 3% for 2018 is in line with reality despite incomplete data, we must interpret some slowdown in land-based tourism compared to the previous 3 years, where there has been a growth of around 10%. On the other hand, figures for cruise tourism show a strong growth of just over 20%. • At the time of the publication of these reports, flight passenger numbers for the first 8 months of 2019 show that there is a slight fall in the number of international passengers. It is too early to say anything decisive about tourism development in 2019, but it is possible that, in the years leading up to the opening of the new airports, there will be weak growth in land-based tourism. • Air Greenland has already claimed that the slowdown in growth is partly due to saturation of the primary destination, Ilulissat, during the summer high season. It will probably take time to get tourists to spread out more geographically and temporally (i.e. to use the shoulder seasons), so although there is plenty of hotel capacity and airplane seats, we still need to 'educate' tourists to turn their eyes to the many destinations other than Ilulissat. • In the coming tourism strategy for the period 2020 - 2023, sustainability will be even higher on the agenda, which will raise some new questions regarding cruise tourism. • On the 18/9, the Danish Defence Minister signed an agreement between the Ministry of Defence and the Greenlandic Government that confirms that Kangerlussuaq airport will be kept open for the Danish Defence. In a press conference at the Greenlandic Government, it was stated that "the Armed Forces must be responsible for the renovation, operation and maintenance of the runway". Currently, it is not clear to what extent the airport will be open for civilian scheduled flights. • The UNWTO expects a global annual tourism growth of 3.3% in the coming years until 2030, so it is hoped that the demand for Greenland will be able to keep up with this, but this is dependent on the extent to which the marketing of all of Greenland is successful, so that sold out accommodation in Ilulissat in the summer high season does not become a limiting factor. • When Air Greenland reports that they have had approx. 1% growth in the first 8 months of 2019, with a total decline of approx. 1% during the same period, this must mean that Air Iceland Connect is experiencing declining demand on their Greenland routes. This may be related to a generally declining demand for Iceland as a destination, of which Wow Air’s bankruptcy is an example. • In Visit Greenland’s strategy for the period 2020 - 2023, which will be published in December, there will be a significant focus on sustainable tourism development and preparation for the opening of the new airports, including the expansion of capacity and an extensive international campaign. We wish you all a really good and prosperous 2019 tourist season! Best regards, Visit Greenland This tourismstatisticreport is compiled by Mads Lumholt, Visit Greenland, September 2019.