Lynx & Hare
Lynx & Hare. Lynx. Hare. 0. 12.00. 16.00. 6.00. What can we say about these data?. What patterns?. patterns orders. thought. facts. emotion. thinking. fragmentation. system. sustained oscillation Period for each population roughly 10 years.

Lynx & Hare
E N D
Presentation Transcript
Lynx Hare 0 12.00 16.00 6.00
What can we say about these data? What patterns?
patterns orders thought facts emotion thinking fragmentation system
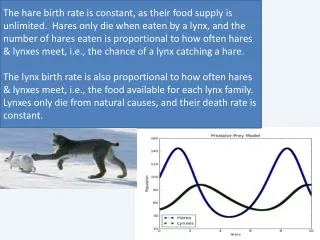
sustained oscillation Period for each population roughly 10 years
Why should we see these cycles in the two population? Why should the peaks and troughs be so uniform? Why should the oscillations be so periodic over a long time frame?
How systems thinking front this? Loops positive loops negative loops Delay
How system dynamics front this? Levels Rates Delay physical delay information delay
Levels Hare Lynx
Practical Behavior Mechanisms How does hare population grow? How does lynx population grow? How do they influence each other?