Download
1 / 19
190 likes | 781 Views
2004 Time Use Survey in Cambodia. By Ms. HANG LINA DG, NIS CAMBODIA. International Seminar on Gender Statistics Incheon, Republic of Korea, 12-14 November, 2013. Contents. Background Reference Period Survey Instrument Data Processing Establishing Activity Groups

E N D
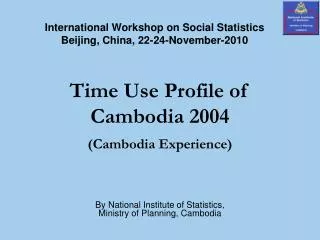
2004 Time Use Survey in Cambodia By Ms. HANG LINA DG, NIS CAMBODIA International Seminar on Gender Statistics Incheon, Republic of Korea, 12-14 November, 2013 2004 Time Use Survey in Cambodia
Contents • Background • Reference Period • Survey Instrument • Data Processing • Establishing Activity Groups • Tabulation and Analysis • Some results • Conclusion
Background The first (and only one)Time Use Survey ever conducted in Cambodia. The data was collected through a time use module included in the Cambodia Socio-Economic Survey 2004 (CSES). Even though the survey is commonly referred to as CSES 2004, it actually collected data from November 2003 through January, 2005.
Reference Period The data were collected continuously throughout the survey period from November 2003 through January, 2005.
Survey Instrument For each sampled household, all household members of age 5 and above were asked to fill in a diary sheet for a sampled diary day. On the diary sheet the respondents were asked to record what activity he or she were doing during each half hour of the sampled diary day. Each half hour is classified according to the activity taking most time during that half hour.
Data Processing After the diaries were filled in by the household members, they were collected by the enumerator. The diaries were checked by enumerators and supervisors in the field, and they were sent to NIS after the survey month. At NIS the diaries were edited and then scanned.
Establishing Activity Groups • All activities we summarized into main activity groups. • Market work: - employee, own business • Agriculture work: - tending rice, tending other crops, tending animal, hunting and fishing. • Household work: - fetching water, collecting firewood, construction, weaving, handicraft, shopping, cooking, washing/cleaning, and care of children and elder. • Leisure:- travelling, leisure and other unspecified activities. • Personal care:- sleeping, eating, and personal care • Studying, including homework, is kept as a separate activity because it is mostly young people who devote time to that.
Tabulation and Analysis • Four kinds of statistics tables are the common, standard type of estimates based on time use data; • Standard mean, the total time devoted to an activity by a population group, divided by the number of persons in the population group. It is a total sized down to the individual level. • Participation Rate, the proportion of the population group that at all devoted some time to the activity. • The average time devote to the activity by those who at all spent some time to it. • Proportion doing various activities at different hours of the day.
Proportion doing activities, population aged 5-17 years by sex and region, CSES 2004
Average time used of population aged 5-17 years by activities, sex and region, CSES 2004
Proportion doing activities, population aged 18-64 years by sex and region, CSES 2004
Average time used of population aged 18-64 years by activities, sex and region, CSES 2004
Proportion doing activities, population aged 65 and older by sex and region, CSES 2004
Average time used of population aged 65 and older by activities, sex and region, CSES 2004
Proportion doing activities, population aged 65 years by sex and marital status, CSES 2004
Average time used of population aged 65 and older by activities, sex and marital status, CSES 2004
Conclusion Females in Cambodia spent more time on productive activities than males do.(market work, agriculture work, household work and housework, F=5.9 hours, M=5.1 h) Girls at the age 10-14 years spend 0.3 hours more on productivities than boys in the same age group so.