How to design a FTTH network
40 likes | 84 Views
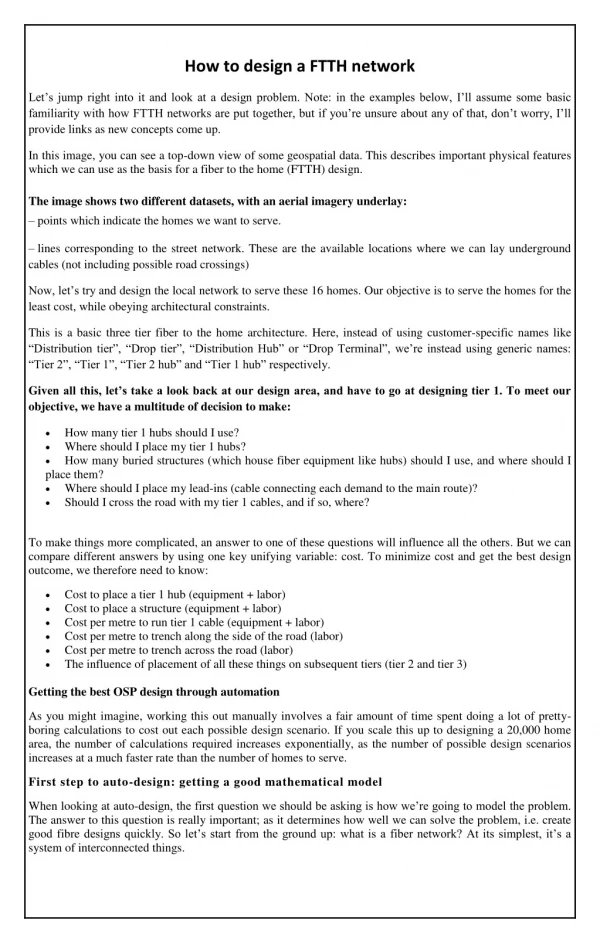
Let’s jump right into it and look at a design problem. Note: in the examples below, I’ll assume some basic familiarity with how FTTH networks are put together, but if you’re unsure about any of that, don’t worry, I’ll provide links as new concepts come up.

How to design a FTTH network
E N D
Presentation Transcript
How to design a FTTH network Let’s jump right into it and look at a design problem. Note: in the examples below, I’ll assume some basic familiarity with how FTTH networks are put together, but if you’re unsure about any of that, don’t worry, I’ll provide links as new concepts come up. In this image, you can see a top-down view of some geospatial data. This describes important physical features which we can use as the basis for a fiber to the home (FTTH) design. The image shows two different datasets, with an aerial imagery underlay: – points which indicate the homes we want to serve. – lines corresponding to the street network. These are the available locations where we can lay underground cables (not including possible road crossings) Now, let’s try and design the local network to serve these 16 homes. Our objective is to serve the homes for the least cost, while obeying architectural constraints. This is a basic three tier fiber to the home architecture. Here, instead of using customer-specific names like “Distribution tier”, “Drop tier”, “Distribution Hub” or “Drop Terminal”, we’re instead using generic names: “Tier 2”, “Tier 1”, “Tier 2 hub” and “Tier 1 hub” respectively. Given all this, let’s take a look back at our design area, and have to go at designing tier 1. To meet our objective, we have a multitude of decision to make: How many tier 1 hubs should I use? Where should I place my tier 1 hubs? How many buried structures (which house fiber equipment like hubs) should I use, and where should I • • • place them? • Where should I place my lead-ins (cable connecting each demand to the main route)? • Should I cross the road with my tier 1 cables, and if so, where? To make things more complicated, an answer to one of these questions will influence all the others. But we can compare different answers by using one key unifying variable: cost. To minimize cost and get the best design outcome, we therefore need to know: Cost to place a tier 1 hub (equipment + labor) Cost to place a structure (equipment + labor) Cost per metre to run tier 1 cable (equipment + labor) Cost per metre to trench along the side of the road (labor) Cost per metre to trench across the road (labor) The influence of placement of all these things on subsequent tiers (tier 2 and tier 3) • • • • • • Getting the best OSP design through automation As you might imagine, working this out manually involves a fair amount of time spent doing a lot of pretty- boring calculations to cost out each possible design scenario. If you scale this up to designing a 20,000 home area, the number of calculations required increases exponentially, as the number of possible design scenarios increases at a much faster rate than the number of homes to serve. First step to auto-design: getting a good mathematical model When looking at auto-design, the first question we should be asking is how we’re going to model the problem. The answer to this question is really important; as it determines how well we can solve the problem, i.e. create good fibre designs quickly. So let’s start from the ground up: what is a fiber network? At its simplest, it’s a system of interconnected things.
This is similar to the mathematical concept of a graph, where our things are ‘nodes’, and the lines connecting them are ‘edges’. This representation is extremely useful for automating design, where edges between nodes in this setting will infer the relationship of connectivity via a fiber optic cable. With these models of both our inputs and outputs, we can then apply an algorithmic approach and build software which helps us get to the best design – using approaches from graph theory and network optimization to serve all our homes for the least cost. Second step: the geospatial data Having a good model for the design problem is great, but there’s no effective way to use the software if we don’t have any data. When we’re talking about data, we’re talking one of two things: Input data (what we use to create the design) Output data (the design itself) • • Input We can see examples of input data in earlier images – addresses, streets, poles. Other kinds of input data we might want are existing conduit, property boundaries, easements, gas pipelines, and areas of special interest. Each of these will give us extra information we can use to generate a design: either things to avoid (e.g. gas pipes), or things we can utilise to save cost (e.g. existing conduit). Output In the same way as input data, it’s important to have a well defined and consistent data structure can represent any design. A typical FTTH design needs to contain detailed information on splicing, routes used, which components are being used at different places in the network, and much more. We’ve defined a data structure to capture all of this in the Biarri Standard Output Schema (SOS). Third step: Getting the software right Automation is great, but we can’t do everything with software. Good design software needs to be built with humans in mind, making it easy to tweak inputs and parameters, make changes, and deliver good designs quickly. Building software which can do all these things is hard. But luckily, you don’t have to do it yourself. Biarri offers a range of software products and services for activities like cost analysis, detailed design, and field surveys. Where to from here? Automation can be a daunting thing. However, it can do some pretty cool things and free up your time to work across different, more interesting tasks. Geospatial data is the foundation to pursuing profitable automation. If you want to get started, get your data in order. And, if you need help don’t hesitate to reach out! For more detail please visit: https://www.gbic-shop.de https://www.cbo-it.de/