GLOBAL WARMING
GLOBAL WARMING. Distribution of solar radiation entering the atmosphere 20% reflected by the atmosphere 20% absorbed by the atmosphere 51% is absorbed by the earth 9% is reflected by the earth and dust Distribution of emitted infrared radiation 17% escapes atmosphere

GLOBAL WARMING
E N D
Presentation Transcript
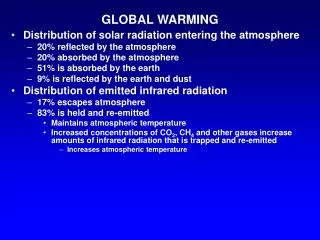
GLOBAL WARMING • Distribution of solar radiation entering the atmosphere • 20% reflected by the atmosphere • 20% absorbed by the atmosphere • 51% is absorbed by the earth • 9% is reflected by the earth and dust • Distribution of emitted infrared radiation • 17% escapes atmosphere • 83% is held and re-emitted • Maintains atmospheric temperature • Increased concentrations of CO2, CH4 and other gases increase amounts of infrared radiation that is trapped and re-emitted • Increases atmospheric temperature
EVIDENCE FOR GLOBAL WARMING • Since 1860 • CO2 concentration in atmosphere has increased by 24% • CH4 concentration in atmosphere has doubled • Mean global temperature has increased by 2oF • 10 hottest days on record have occurred since 1980
ENVIRONMENTAL EFFECTS OF GLOBAL WARMING • Average temperature will increase by 2 to 6oF in next century • An increase in extreme weather events • Droughts, floods etc. • Concern for insurance industry • Sea levels will increase .5 to 3 feet • Threaten coastal resources, wetlands, and islands • Saline water will pollute water supplies of coastal cities • Increased range of diseases associated with tropical climates • Malaria, dengue fever, and yellow fever will occur at higher latitudes • Heat stress and death of humans and animals • Particularly a concern in elderly • Increases air conditioning needs • Angus cattle? • Rapidly reproducing species of weeds, rodents, insects, bacteria and viruses may occur at higher latitudes • Crop may be susceptible to new insect and disease problems • Reduced forest health and changes in tree species
GASES ASSOCIATED WITH GLOBAL WARMING Current Rate of Half % of US GHG Relative concentration increase life GHF contribution GH effect ____Gas____(ppmV)(%/yr) _(yr)_emissions__%__( /kg)(_/mole) Carbon dioxide 360 .5 150 81 55-60 1 1 Methane 1.7 .7 7-10 10 15-20 62 22 Nitrous oxide .31 .2 150 7 5 310 310 Fluorinated hydrocarbons - - - 2 - - - Water vapor - - - - - - - • Sources • Carbon dioxide • Hydrocarbon combustion • Methane • Livestock, manure, wastewater treatment, landfills and fuel production • Nitrous oxide • Hydrocarbon combustion, industrial processes, denitrification of manure and soil N • Fluorinated hydrocarbons • Refrigeration, dry cleaning, chemical manufacturing • Water vapor • Increased temperature from other GHG
LIVESTOCK AGRICULTURE’S ROLE IN GREENHOUSE GASES • Nitrous oxide • Difficult to determine amount • Likely to be high in animals that excrete high concentrations of Nitrogen • N2O emissions are 10 times greater from fields with manure application compared to unfertilized fields • N2O emissions can be considerable from fields or pastures with soil compaction under wet conditions
Methane CH4 % of million metric % of anthropogenic Sourcestons/yrtotalsources Natural Wetland 115 24.4 - Oceans 15 3.2 - Termites 20 4.2 - Burning 10 2.1 - Industrial Gas and oil 50 10.6 16.1 Coal 40 8.4 12.8 Charcoal 10 2.1 3.2 Landfills 30 6.4 9.6 Waste water treatment 25 5.3 8.0 Agricultural Rice 60 12.8 19.3 Livestock 80 17.0 25.8 Manure 10-25 2.1 3.2-7.7 Burning 5 1.0 1.6
Implications • Anthropogenic sources contribute 66% of all methane emissions • Livestock production and manure are the largest anthropogenic sources • Methane emissions from anthropogenic sources are increasing 1%/yr • Methane emissions from livestock in Iowa Direct emissionsManure% of total --------------tons/year------------ Cattle 352,000 14,900 73.5 Swine 22,400 102,000 24.9 Poultry NA 1,770 .4 Sheep 4,312 208 .9 Horse 983 170 .2
GREENHOUSE GAS PRODUCTION IN LIVESTOCK • Methane • Produced by anerobic fermentation of carbohydrates in the rumen, large intestine, or stored manure • Represents a loss of 4 to 10% of the dietary energy in ruminant animals
Methane production Starch Cellulose (In grains) (In plant fiber) Digested by bacterial enzymes Glucose (a simple sugar) In aerobic organisms run through electron transport to produce Metabolized by bacteria through ATP and H2O Glycolysis NADH2 Pyruvate (a 3-C intermediate) In anerobic organisms In aerobic organisms run through TCA cycle producing more NADH2used NADH2 used for ATP production in electron transport Acetic acid Propionic acid Butyric acid CH4 (Volatile fatty acids) (Belched gases by eructation)
VOLATILE FATTY ACIDS • In animals • Absorbed through wall of the rumen in ruminants or large intestine of ruminants and nonruminants • Metabolized by the animal for energy • Main source of energy for ruminants • Provide 70% of the energy in ruminants • Production of different VFAs and methane vary with diet • In manure • Volatile fatty acids contribute to manure odor • Acetic acid and propionic acid smell like vinegar • Butyric acid smells like rancid butter
FACTORS AFFECTING METHANE AND VFA PRODUCTION IN THE RUMEN OF RUMINANTS • Dietary factors • High forage levels of diet • Promotes cellulose digesting bacteria in rumen • Increases production of acetic acid and methane • Decreases production of propionic acid • High grain levels of diet • Promotes starch digesting bacteria in rumen • Increases production of propionic acid • Decreases production of acetic acid and methane • Fine grinding or pelleting of forage • Decreases the amount of time the cattle spend chewing • Decreases saliva flow and secretion of the buffer, sodium bicarbonate. • Allows rumen pH to decrease • Decreases growth of cellulolytic bacteria • Decreases production of acetic acid and methane • Increases production of propionic acid
Increasing forage maturity • Causes more chewing • Increases saliva flow and secretion of buffer, sodium bicarbonate • Increases rumen pH • Increases growth of cellulolytic bacteria • Increases production of acetic acid and methane • Decreases production of propionic acid • Feeding fats containing unsaturated fatty acids • An unsaturated fatty acid is a fatty acid that has one or more double bonds in the chain • The rumen bacteria use hydrogens to saturate (replace double bonds with hydrogens) unsaturated fatty acids • Example H H H+ H H H H H C C C C COOH H C C C C COOH H H H H H H H H Unsaturated fatty acid Saturated fatty acid • Results • Decreased acetic acid and methane production • Increased propionic acid production • Important to feed no more than 5% fat to ruminants
Feeding ionophores • Antibiotics that include • Monensin, sold as Rumensin • Lasalocid, sold as Bovatec • Increase propionic acid production • Decrease acetic acid and methane production • Production factors • Rate of gain • Regardless of diet, ruminants produce methane each day at a maintenance level • Every day the cattle or sheep is on the farm, they produce more methane • The faster an animal grows or the more milk is produced, the lower the amount of methane produced per unit of meat or milk produced
N2O PRODUCTION • N2O is produced during denitrification of NO3 • Occurs under anerobic conditions • Wet, compacted soils • Anerobic lagoons • Amount associated with livestock production is directly related to amounts of N excreted.
FACTORS AFFECTING N2O PRODUCTION • Diet • Nonruminants • Amounts of protein fed • Increased protein = increased N excretion • Amino acid balance • Poor amino acid balance = increased N excretion • Ruminants • Amounts of protein fed • Increased protein = increased N excretion • Ratio of degraded to undegraded protein in the rumen • Increased protein degraded in rumen = increased N excretion • Ratio of degradable protein to digestible carbohydrate in the rumen • High proportion of degradable protein to digestible carbohydrate = increased N excretion • Digestible carbohydrate is needed to convert degraded NH3 into microbial protein • Amino acid balance • Poor amino acid balance = increased N excretion • Manure handling • Storage losses • Anerobic Lagoons > Slurries > Compost
STRATEGIES TO REDUCE GHG EMISSIONS ASSOCIATED WITH LIVESTOCK PRODUCTION • Production system manipulation • Limit management approaches that just maintain ruminant animals with little production • Example - Backgrounding cattle • Maximize reproductive efficiency • Maximize disease control and herd health • Dietary manipulation • Nonruminants • Manage diet to minimize N excretion and waste • Review N section • Do not feed excess protein • Balance for amino acids • Use crystalline amino acids to create the ‘ideal’ protein • Use phase feeding with 4 or more phases • Use split sex feeding • Limit feed waste • Promote lean growth through genetic manipulation or feed additives: Ractopamine
Ruminants • Maximize the proportion of grain in the diet • Effects • Reduces CH4 production • Increases incorporation of NH3 into microbial protein Reduces urinary N • Increases rate of gain Reduces lb GHG/lb gain • Maximum proportions of grain • Beef feedlot – 90% • Lactating dairy cows – 50% • Consequences of excess grain feeding Beef feedlot - Acidosis, Liver abscesses Dairy cows – Low milk fat, Displaced abomasum, Laminitis • Limitation of strategy • Amount of CO2 released during production of N-fertilizer used to produce grain • Processing feeds • Grinding and pelleting • Reduces CH4 by 20% • Steam-flaking • Reduces CH4 by 40%
Feed ionophores • Compounds • Monensin, sold as Rumensin Do not feed to sheep • Lasalocid, sold as Bovatec • Reduces CH4 by 28% • Addition of fats to ruminant diets • Reduces CH4 by 33% • Can’t feed more than 5% of the diet • Greater amounts adversely affect fiber digestion and feed intake • Forages should be grazed or harvested when immature • Effects • Immature forages are more digestible and have less fiber than mature forages Reduces CH4 • Implications • Use rotational grazing Reduces CH4 by 22 to 50% compared to continuous grazing • Incorporate legume forage species in pastures Reduces CH4 by 25% compared to grass
Utilization of production-enhancing agents • Types • Beef cattle Steroid implants (Trenbolone acetate, Estradiol) Ractopamine • Dairy cattle Bovine somatotropin • Effects • Increases incorporation of amino acids into animal protein Reduce N excretion • Reduces GHG/lb product by increasing production Reduces CH4/lb product by 4% • Manage protein nutrition to minimize N excretion • Review N strategies • Strategies • Reduce CP of diet Reducing CP concentration of dairy cow from 17.5 to 12.5% CP: Reduce N2O by 78% • Lower the Rumen Degradable Protein:Undegradable protein ratio • Increase energy concentration of the diet • Use crystalline amino acids to balance amino acids of lactating dairy cows
Manipulation through manure handling and storage • Effects of manure storage method Anerobic Slurry Stockpiled lagoonearthen pondDeep litterCompost Relative emissions CH4 10 8 6 1 Total GHG Very high 4 2-3 1 Dominant gas CH4 CH4 CH4 & N2O N2O • Effects related to: • C:N ratio of the manure Separated Farm yard Deep litter manure without manure with beddingbedding C:N 10 20 CH4 (g/cow/7 weeks) 26 3 N2O (mg/cow/7 weeks) 866 42 GHG (CO2 equiv./cow/7 wk) 878 82 • O2 exposure • Reduces CH4 • Surface area • Increased surface area increases gas release • Covers reduce gas release
Methane capture and use • Requirements • Anerobic, air-tight structure • pH control • pH 6.8 – 7.0 • High temperature • 95oF • Can not have a high concentration of NH3 • Expense • $400 - $500/animal for large dairies (<3700 cows) • $1200/animal for small dairies (<500 cows) • Production SwineDairyBeefPoultry Gas yield, cubic ft/lb solids 12 7.7 15 8.8 Energy production, BTU/hr/animal 103 568 775 5.25 Animals needed to heat a 1500 ft2 house 535 99 72 10714
Manipulation through manure application • Frequent application of manure • Prevents anerobic decay • Traps C in soil organic matter or released to atmosphere as CO2 • Timing of manure application • Avoid application in later winter and early spring • Plant growth is slow • Little uptake of NO3 • Soils are water-logged • Anerobic conditions promote denitrification of NO3 to N2O • Method of application • Injection of manure reduces all N emissions by 90% • Band application of surface produces more N2O than uniform surface application
Manipulation of GHG through carbon sequestration • Plants sequester C, reducing atmospheric CO2 • Amounts of C sequestered Croptons C/acre Pasture 1.0 Range .12 Hay land .5 Grain 2.0 Trees 3.7 • Potential • U.S. grazing lands = 524 million acres • C sequestered = 60 million tons = 1.6 x all C emissions from all agriculture • C sequestered may be increased by: • Incorporation of legume forage species in pastures • .18 - .27 ton/acre/year • Improved grazing management (Weed control, alternate water sites) • .05 - .13 ton/acre/year • Rotational grazing • 25% increase
Producers may economically benefit from increased C sequestration by selling C credits to industries producing Greenhouse Gases • 1 C credit = 1 ton C sequestered beyond a base value before improved management = 3.67 tons CO2 removed from the atmosphere • Credits sold through markets • Chicago Climate Exchange • To date, few trades because of voluntary market