
Do heavier people burn more energy? Does wine consumption affect cause a decrease in heart disease?
Do heavier people burn more energy? Does wine consumption affect cause a decrease in heart disease?. These questions reflect a desire to understand the relationship between two variables. What we need: A plot/graph to view the relationship Characteristics to describe

Do heavier people burn more energy? Does wine consumption affect cause a decrease in heart disease?
E N D
Presentation Transcript
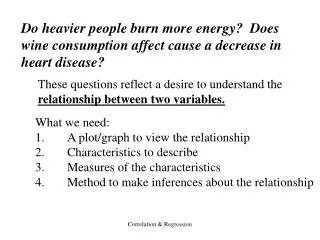
Do heavier people burn more energy? Does wine consumption affect cause a decrease in heart disease? These questions reflect a desire to understand the relationship between two variables. • What we need: • A plot/graph to view the relationship • Characteristics to describe • Measures of the characteristics • Method to make inferences about the relationship Correlation & Regression
The graph…a Scatter Plot Response variable (dependent variable) Y X Explanatory variable (independent variable) Correlation & Regression
Do heavier people burn more energy? Response: metabolic rate Explanatory: weight or mass Does wine consumption cause a decrease in heart disease? Response: death rate from heart disease Explanatory: wine consumption Correlation & Regression
Interpreting…characteristics to look for: • Patterns: • Form (clusters, scatter, linear..) • Direction (positive, negative) • Strength ( how closely points follow form) • Deviations: • Outliers Interpret the last two scatter plots…. Correlation & Regression
Options to consider: Adding a categorical variable Correlation & Regression
Strength? Scatter plot: relationship between quantitative variables Form: Linear is probably the most common form Strength: We can measure the strength of a linear relationship …because our eyes can deceive us!!! Strength?
Correlation …measure the direction and strength of a linear relationship Standardised value of each x Standardised value of each y Correlation is an average product of standardised values Correlation & Regression
Correlation = r • Quantitative variables • Linear relationships • r has no units • r can be between –1 and 1 • Positive r = • positive association • Negative r = • negative association • 0 = no association • r is influenced by outliers
Correlations: Mass (kg), Rate (cal) Pearson correlation of Mass(kg) and Rate(cal) = 0.865 P-Value = 0.000 r Correlation & Regression
Correlations: Mass (kg)_F, Rate (cal)_F Pearson correlation of Mass(kg)_F and Rate(cal)_F = 0.876 Correlations: Mass (kg)_M, Rate (cal)_M Pearson correlation of Mass (kg)_M and Rate (cal)_M = 0.592 Correlation & Regression
Correlations: Alcohol, heart_death rate Pearson correlation of Alcohol and hrt_death rate = -0.843 Correlation & Regression
Correlations: Alcohol Wine consumption, heart death rate Pearson correlation of Alc Wine consumption and hrt death rate = -0.648 Correlation & Regression
Linear relationships…using a LINE We can summarise an overall linear form with a line…the best line is called the Regression Line Correlation & Regression
A regression line describes how a response variable changes as an explanatory variable changes. We can now predict a value of y when given an x. What would be the death rate due to heart disease if the average daily consumption of wine was 3 glasses? 191.66 deaths per 100,000 Correlation & Regression
How do we determine the regression line? We want the vertical distances from the points (observed) to the line (predicted) to be as small as possible…this means our error in predicting y is small. Correlation & Regression
Calculating the line… We will use the method of least squares to calculate the line. Least squares regression is the line that makes the sum of the squares of the vertical distances as small as possible. Equation of the line (read “y hat”) b is the slope (rate of change in y when x increases) a is the y intercept (value of y when x is 0) Correlation & Regression
The regression equation is death rate = 260.563 - 22.9688 wine consumption S = 37.8786 R-Sq = 71.0 % R-Sq(adj) = 69.3 % Analysis of Variance Source DF SS MS F P Regression 1 59813.6 59813.6 41.6881 0.000 Error 17 24391.4 1434.8 Total 18 84204.9 Correlation & Regression
Facts about regression…. • Clear distinction between the response variable and the explanatory variable. • Correlation and slope…a change in one s of x corresponds to a change of r s in y. • Least-squares regression line passes through • Some variation (spread) in y can be accounted for by changes in x when there is a linear relationship. The square of the correlation coefficient is the the fraction of the variation in y values that is explained by changes in x. = coefficient of determination Correlation & Regression
The regression equation is death rate = 260.563 - 22.9688 wine consumption S = 37.8786 R-Sq = 71.0 % R-Sq(adj) = 69.3 % R-sq can have a value between 0 and 1. Correlation & Regression
VARIATION OF DEPENDENT Y Correlation & Regression
Residuals… the left overs from least-squares regression Deviations from the overall pattern are important. The deviations In regression are the “scatter” of points about the line. The vertical distances from the line to the points are called residuals and they are the “left-over” variation after a regression line is fit. Residual = observed y – predicted y Correlation & Regression
The regression equation is death rate = 260.563 - 22.9688 wine consumption s = 37.8786 R-Sq = 71.0 % R-Sq(adj) = 69.3 % The residuals are…. Obs Alcohol hrt_deatFit SE Fit Residual St Resid 1 2.50 211.00 203.14 8.89 7.86 0.21 2 3.90 167.00 170.99 9.23 -3.99 -0.11 3 2.90 131.00 193.95 8.70 -62.95 -1.71 4 2.40 191.00 205.44 8.97 -14.44 -0.39 5 2.90 220.00 193.95 8.70 26.05 0.71 6 0.80 297.00 242.19 11.76 54.81 1.52 7 9.10 71.00 51.55 23.29 19.45 0.65 X 8 0.80 211.00 242.19 11.76 -31.19 -0.87 9 0.70 300.00 244.49 12.00 55.51 1.55 10 7.90 107.00 79.11 19.39 27.89 0.86 11 1.80 167.00 219.22 9.72 -52.22 -1.43 12 1.90 266.00 216.92 9.57 49.08 1.34 13 0.80 227.00 242.19 11.76 -15.19 -0.42 14 6.50 86.00 111.27 15.11 -25.27 -0.73 15 1.60 207.00 223.81 10.06 -16.81 -0.46 16 5.80 115.00 127.34 13.15 -12.34 -0.35 17 1.30 285.00 230.70 10.64 54.30 1.49 18 1.20 199.00 233.00 10.85 -34.00 -0.94 19 2.70 172.00 198.55 8.77 -26.55 -0.72 The mean of residuals is always equal to 0 Correlation & Regression
Residual Plots • Things to look for: • A curved pattern means the relationship is not linear. • Increasing/decreasing spread about the line • Individual points with large residuals • Individual points that are extreme in the x direction Do we have any influential points here? Correlation & Regression
Ideal residual pattern Curvature…a linear fit is not appropriate Increasing variation Correlation & Regression
Attention!! Caution!! • Correlation and regression describe only linear relationships • R and r-sq are not resistant • Do not extrapolate!!! What is extrapolate? • Correlations based on averages are too high when applied to individuals…if the data has been “averaged”, the values of correlation and regression cannot be used with un-averaged values. (i.e., average alcohol consumption per country…not individuals). • Lurking variables…like the male/female variable in the weight vs. energy and the possible Mediterranean variable in the wine data. • Correlation/association is not causation. Correlation & Regression


