Download
1 / 62
640 likes | 1.43k Views
Comparison of Acceptance Criteria . The acceptance rates of simulated samples with and without various problems were examined to compare different acceptance criteria E. Clarkson National Center for Advanced Materials Performance Presented to: Mil-HDBK-17 NCAMP December 2005, Santa Monica CA.

E N D
Comparison of Acceptance Criteria The acceptance rates of simulated samples with and without various problems were examined to compare different acceptance criteria E. Clarkson National Center for Advanced Materials Performance Presented to: Mil-HDBK-17 NCAMP December 2005, Santa Monica CA
Qualifying Sample Variables • Sample size • n = 18 & n = 30 • Mean • Set at 100 • Also tested at the 5th and 95th percentiles to see the effect of an unusually high or low qualifying sample mean. • Coefficient of variation (std dev / mean) • 2%, 6%, and 10% • Since the mean is set to 100, the Coefficient of Variation in % and the standard deviation have the same value.
Equivalence Sample Variables 50,000 samples generated for each set of conditions. • Sample size • Tested at n = 2 to n = 10 • Mean • Set at 100, at 95, and at 100 – 1σ. (σ = standard deviation) • Due to random generation of sample, the means will randomly vary around the preset value. • Coefficient of variation (C.V.) • Set at 2%, 6%, and 10%, • Set at 1.5*C.V. of Qualifying sample. • Due to random generation of sample, the C.V. will randomly vary around the preset value.
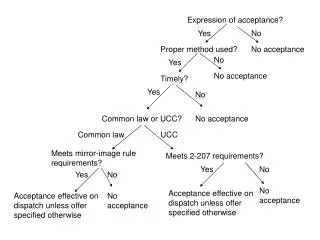
Acceptance Criteria • Agate Criteria: • Detailed in DOT/FAA/AR-03/19 “Material Qualification and equivalency for Polymer Matrix Composite Material Systems: Updated Procedure”, Final Report Sept 2003 with alpha (α) set at 0.01. • Cpk Criteria • A minimum Cpk of 1.33 is desired. The needed sample mean and minimum values are computed from the qualifying sample values based on that criteria. • Criteria presented at Sept 1994 Mil-Hdbk-17 meeting. • A total of 8 different acceptance criteria used at that time by companies were tested to see how they performed compared to the recommended (AGATE) criteria.
Acceptance Criteria Criteria presented at Sept 1994 Mil-Hdbk-17 meeting • Sample Average > B-Basis, Sample Minimum > A-basis • Sample Average > B-Basis, Sample Minimum > A-basis, Coef. Of Var < 7 • Sample Minimum > B-Basis • Sample Average > Sample Minimum > B-Basis • Sample Average > Sample Minimum > • Sample Average > Sample Minimum > • Sample Average > • Sample Average > Sample Minimum > Where and s are the mean and standard deviation of the qualifying sample k is the one-sided tolerance factor based on the number of test values and n is the number of tests in the equivalence sample
Agate Criteria • DOT/FAA/AR-03/19 specifies that the equivalency sample mean must be greater than: and the minimum value in the equivalency sample must be greater than: with: • the qualifying sample mean • the qualifying sample standard deviation • n the size of the equivalency sample • The kmin and kmean values come from tables 20 and 21 in DOT/FAA/AR-03/19
Cpk Criteria • A minimum Cpk of 1.33 is desired. • The equivalency sample is compared to test values are computed as follows: • The equivalency sample mean must be greater than: • The minimum value of the equivalency sample must be greater than: • is the qualifying sample mean • is the qualifying sample standard deviation
Comparison of Agate and Cpk criteria • For n = 5 and producers risk (α) = 0.01 kmean = 1.1425 ≈ Cpk = 0.852 kmin.ind. = 3.0715 ≈ Cpk = 1.024 By allowing for a single retest of samples that fail the Agate criteria, the producers risk (α) drops to 0.012 = 0.0001 • For n = 5, kmean = 1.739 ≈ Cpk = 1.296 kmin.ind. = 4.2629 ≈ Cpk = 1.421 Agate criteria with one retest ≈ Cpk criteria with no retest.
Type I and Type II ErrorOtherwise known as Producer’s risk and Consumer’s risk
Comparison of Criteria for producer’s risk • Criteria #2, #3, #4, #5, #6, and #8 all reject far too many ‘good’ samples. The producers risk for those samples range from approx. 10% at the lowest to nearly 90% at the highest. • To simplify the presentation, the remaining slides examine only criteria #1, #7, Cpk and Agate.
Effect of the size of the Equivalency Sample What effect does the size of the equivalency sample have on the probability of rejection of ‘good’ samples?
Rejection rate of simulated “Good” samples Qualifying Sample Size 30
What about the consumer’s risk? How well do these criteria identify ‘Bad’ Samples? To assess the impact of various types of problems, the mean and the coefficient of variation of the simulated samples were changed to determine acceptance rates for the different criteria.
Samples were simulated to have the following problems: • The mean lowered from 100 to 95 • The mean lowered by 1 std. dev. (σ) • The standard deviation (σ) was increased by 50% and the mean lowered by ½ σ. • Mean shifted randomly by 1 std dev. (σ) • Co-efficient of variation increased from 2 to 6 and to 10.
What should happen when the mean changes? • If mean shifts down, then the acceptance rate should go down • If mean shifts randomly (both up and down) then the variance is increased and the acceptance rate should go down.
Increasing the coefficient of variation and lowering the mean
What should happen when the coefficient of variation increases for the equivalency sample? When the equivalence sample has a larger coefficient of variation (or standard deviation) than the qualifying sample, the rejection rates should go up.