Download
1 / 9
110 likes | 830 Views
Real Time Quality Control (Batch monitoring) of Pharmaceutical Production Processes. Chris Ambrozic and John Parsons Umetrics Inc., Kinnelon, NJ 07405 www.umetrics.com Presented at FDA, 28 Nov., 2001. Real Time Quality Control (Batch monitoring). Background

E N D
Real Time Quality Control (Batch monitoring)of Pharmaceutical Production Processes. Chris Ambrozic and John Parsons Umetrics Inc., Kinnelon, NJ 07405 www.umetrics.com Presented at FDA, 28 Nov., 2001 batch.ppt
Real Time Quality Control (Batch monitoring) Background • Process Analysis Technology (PAT) provides valuable process information. • New opportunities, to monitor the evolution of theprocess in real time, using PAT + traditional data. • Necessitates a summarizing (modeling) of the data with minimal or no loss of information. • The resulting model parameters provide an improved interpretation of the process (process knowledge ++). • Displayed as batch control charts batch.ppt
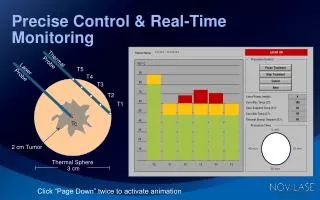
Quality Control today made after batch completion; Upsets are found too late, no correction is possible Real Time Quality Control made during batch evolution Upsets found earlier, corrections possible Based on summarizing adequate data measured on a representative set of good batches; Batch control charts. Control limits based on average batch trace ± 3 provide “6 sigma quality control” potential Pharmaceutical Production -- Batch Processes batch.ppt
Part of a data table of several evolving good batches Right, Summary of table control limits batch.ppt
Batch Control Charts of a mixing process (pharm)Two summary traces of good batch (green) ± 3 (red) Good batches must evolve inside these limits batch.ppt
Monitoring the evolution of new Batches (On line) Bad batch (black) as it is evolving, seen outside the limits Deviations are interpreted with Contribution Plots Bad batch batch.ppt
Control chart of the culprit variable batch.ppt
Real Time Quality Control (Batch monitoring) • Models the evolution of representative good batches • Take all (incl. PAT) data and their correlation into account • Use control charts for display, with limits computed from traces of good batches • New batches monitored as they are evolving • Problems detected and interpreted on the fly • Culprit variables in problem batches clearly identified • Quality of the whole batches predicted as it is evolving and at completion- possible 6 sigma control • Based on multidimensional informative data measured during the batch evolution + multivariate analysis batch.ppt
Benefits B-SPC; same principles as MSPC • Multivariate batch modeling Allows interference and correction as batch is evolving, and prediction of final quality • Applies to evolving batches (individual observations), and whole batches as units • Results shown as easily interpretable control charts • Makes batch quality control more reliable, and faster; less scrap, less variability • Facilitates compliance inspection batch.ppt