These Tables Provide Data_Intro
<br>In our day to day life, we see various kinds of tables which consist of numbers, figures, names, etc. <br>These tables provide u2018Datau2019. <br>

These Tables Provide Data_Intro
E N D
Presentation Transcript
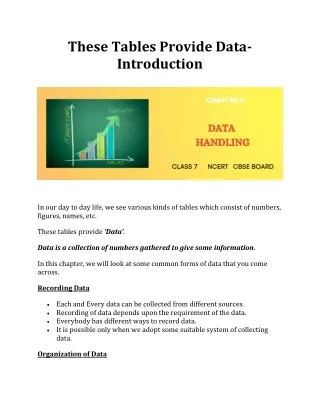
These Tables Provide Data- Introduction In our day to day life, we see various kinds of tables which consist of numbers, figures, names, etc. These tables provide ‘Data’. Data is a collection of numbers gathered to give some information. In this chapter, we will look at some common forms of data that you come across. Recording Data Each and Every data can be collected from different sources. Recording of data depends upon the requirement of the data. Everybody has different ways to record data. It is possible only when we adopt some suitable system of collecting data. Organization of Data
Raw data is difficult to read, so we have to organize it in such a way so that we can use it in need. If we want to get any type of particular information from the given data quickly, data can be organized in a tabular form The data is represented in a tabular form using frequency distribution and the tally marks. Concepts of Data Handling Meaning of Range The difference between the highest and lowest observations in a given data is called its range. Mean or Arithmetic Mean: Average is a number that represents or shows the central tendency of a group of observations or data. Arithmetic mean is one of the representative values of data. The average or Arithmetic Mean (A.M.) or simply mean is defined as follows: Define Mode: Mode is another form of central tendency or representative value. The mode of a set of observations is the observation that occurs most often. Median: Median is the middle most observation of the data arranged in ascending or descending order. Bar Graph: A bar graph is a representation of numbers using bars of uniform widths.
Double bar graphs: It help to compare two collections of data at a glance. Meaning of Probability A coin has two sides, either Head or tail. So, when you toss the coin, either Head or tail may come. But, you can’t predict whether head or tail will come. There is a chance that Head may come when you toss the coin. Similarly, there is chance for tail to come So, the situation which may or may not happen, is said to have a chance of happening. This means that there is a chance for head to come or not come. This is called chance of happening. Important Note: The probability of an event which is certain to happen is ‘1’. The probability of an event which is impossible to happen is ‘0’.