Download
1 / 19
190 likes | 202 Views
In todayu2019s American cities, adopting the use of advanced technology and better approaches to clean water and sewer are common and often required by law. Cities providing public water delivery have not only grown in population size and in number, but also in their attitudes toward public health, and innovations involving system designs, technologies and accepted practices. In the 19th century cast iron was added to the common use of clay, lead and wooden pipes by cities to convey water and wastewater. In the 20th century, continued innovation carried ductile iron, concrete and cement,

E N D
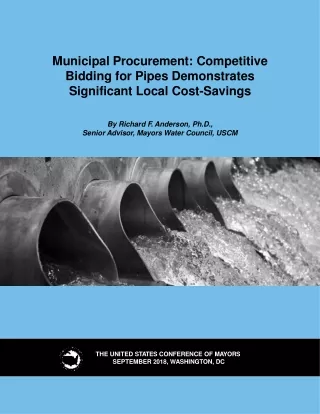
MunicipalProcurement: Competitive Biddingfor PipesDemonstrates SignificantLocalCost-Savings By RichardF.Anderson,Ph.D., Senior Advisor,Mayors WaterCouncil,USCM THEUNITED STATESCONFERENCE OFMAYORS SEPTEMBER 2018,WASHINGTON,DC
THEUNITEDSTATESCONFERENCEOFMAYORS StevenK.Benjamin Mayor of Columbia, SC President BryanK. Barnett MayorofRochesterHills,MI VicePresident GregFisher MayorofLouisville,KY SecondVicePresident TomCochran ExecutiveDirectorandCEO
MunicipalProcurement:Competitive BiddingforPipesDemonstrates SignificantLocalCost-Savings ByRichardF.Anderson,Ph.D. SeniorAdvisor U.S.ConferenceofMayorsWaterCouncil July2018
TABLEOFCONTENTS Mayor’sBriefing..............................5 BackgroundandPurpose......................5 LocalGovernmentsandtheAffordabilityCrisis........5 TheMagnitudeandTrajectoryofLocalInvestmentin WaterandSewerPipes.......................6 TheCostofPipeProcurement....................7 PipePerformanceExpectations..................9 PublicSafetyandtheEnvironment................11 Conclusion.................................12 DiscussionQuestions........................13 References.................................14 Appendix..................................15 OhioCommunities..........................16 CarolinaCommunites........................16 MichiganCommunites........................17 ArkansasCommunites........................17
MAYOR’SBRIEFING In today’s American cities, adopting the use of advanced technology and better approaches to clean water and sewer are common and often required by law. Cities providing public water delivery have not only grown in population size and in num- ber, but also in their attitudes toward public health, and innovations involving system designs, technologies and accepted practices. In the 19th century cast iron was added to the common use of clay, lead and wooden pipes by cities to convey water and wastewater. In the 20th century, continued innovation carried ductile iron, concrete and cement, and plastic pipes into the market. In the 21st century, new generations of plastics, advanced composites, and other materials are being added to a long list of viablepipingmaterials.Technologicaladvancementsinpipematerialshavehelped to support a growing national population while continuing to improve on cost and performance and achieve public health protection goals to guard against waterborne parasites andtoxiccontaminants. The daunting challenge cities face today is the urgent need to replace hundreds of thousands of miles of aging and failing pipe. Pipes are the single most costly water and sewer capital investment category. Mayors want efficient solutions that make the best use of limited resources without compromising the performance or safety of their water systems. One solution that municipalities can no longer afford to overlook is opening- up their procurement processes so that managers have the freedom to consider all suit- able project materials. Adopting practices and policies that encourage standardized comparisons of different pipe materials for water, sewer, and stormwater projects pro- vides mayors with an opportunity to reduce the local cost of pipes and maintain equal or better public safety and material performance levels. A review of new information reveals standardized cost comparisons demonstrate significant price point differences andupdatingprocurementpoliciescansaveas much as 30%ofcapitalcosts. BackgroundandPurpose In2013theMayorsWaterCouncil(MWC)released“MunicipalProcurement:Pro- curement Process ImprovementsYield Cost-Effective Public Benefits”,a report examining procurement practices in thewater infrastructure sector.Thereport made a business caseforconsideringalternativepipematerialsolocalgovernmentscouldrealizepublic benefits(e.g.,cost, performance, safety).The report suggestedtheneedtochangeout- dated procurementpolicies,andthatthebiggestimpedimenttoadoptingthesechang- esstemmed fromthereluctanceoflocalprocurementofficialstobreakfromconvention. Thisreportpresentsinformationfromnewresearchthatdemonstratesthemeritsof adoptingopenprocurementpoliciesandnewpracticesthatapplycompetitiveconsid- erationofalternativepipematerials.Thesepolicieswillhelplocalofficialsmaximize resourcesand practice goodgovernance. There are three critical factors to consider when procuring water and sewer pipes: cost, materials performance, and public safety. This paper examines each of these fac- tors relying on new standardized comparisons for alternative pipe material cost, and recent surveys reporting on pipe performance characteristics. Based on standard cost comparisons between different pipe materials, it can be estimated that applying such analysis in an open procurement process can yield substantial cost-savings without havingto sacrifice performance orsafety. LocalGovernmentsandtheAffordabilityCrisis Localgovernmentsarestrugglingtodealwithhistoricallyhighcoststoprovidewater and sewer infrastructure and services. Census estimates from 2015 suggest that cities and countiesspentover$118billioninthewaterand sewer sectors,andrecovered$114 Page10
billion (or 96 percent) through rates, charges and fees. Despite recent improvement in customer revenues, the unrelenting increases in total costs are fueling household afford- ability impacts that are both significant and widespread. Federal and State financial assistance has been on the wane for over 30 years, but the U.S. Environmental Protec- tion Agency (EPA) and State regulators continue to require greater levels of local spend- ing to accomplish national goals by imposing unfunded mandates on local utilities. Cit- ies are also facing a challenge to add as much as 25 percent to current water and sewer capacity to service the expected 80 million new Americans the Census predicts by 2051. These factors converge at the local level where cities are seeking efficiencies, innovationandothercost-savingsmeasurestotakethepressureoffrapidlyrisingrates. TheAmericanWaterWorksAssociationestimates that itwill costover$1.3trillion to replace our nation’s water infrastructure. There are an estimated 240,000 water main breaks/year, $2.6B wasted on lost water and sewer overflows due to aging pipes, and atleast17%ofpotablewaterlosttoleakage. Residential water rates have gone up by 137% since 2000. A 2017 Michigan State University study projected that water could be unaffordable for 1/3 of Americans in five years. A 2016 US Government Accountability Office report surveyed ten mid and large-sized cities with declining populations and found that the cost for water and wastewater service is almost twice the affordability threshold for low-income custom- ers in 40 percent of the cities it reviewed, with further rate increases on the way. To make matters worse, these communities typically have some the oldest infrastructure andreceivetheleastamountoffunding for infrastructurerepairprojects. TheMagnitudeandTrajectoryofLocal InvestmentinWaterandSewerPipes Local government spent over $359 billion between 1993 and 2017 on underground assets.Materialfailureandreplace/repairprogramsmaybepoorto excellentbasedon factors such as asset management, implementation of best practices, and budget con- straints.Costandperformanceovertime arecritical elements ofsystemdesigndecisions, sothemagnitudeof localpipeinvestmentsinvitesinterestinprocurementdecisions. A25-yearperiod (1993-2017)providesalong-termframeofreferenceand estimate of cumulative investment. Construction investment in sewer line and pumps and waste- water line and drains from 1993 to 2017 was $359 billion, while construction invest- mentsinwater and sewer/wastewater plantswas$313billionduringthatsame period. Table1 SOURCE:U.S.Census,StateandLocalGovernmentConstructionSpending Page10
Figure1 THECOSTOFPIPEPROCUREMENT Pipes are one of largest single cost components of water and sewer/wastewater systems (EPA estimates that pipes are 60% of project costs). The continual need for local investmentsin pipes adds up over time.Spending on pipes can vary widely, (Figure 1 and Table 1), and there is an expectation that a large replacement cost is imminent as existing pipes, especially cast iron pipe, approaches the end of its design life. The pipes provide such a basic service in the community that they must perform with cer- tainty, and that is why the pipe materials in use have undergone dramatic change. For example, in the drinking water market, the pipes in use today (Table 2) have displaced mostwoodenandleadpipesandcast ironand asbestoscementwatermainsarephas- ing out. Similar changes have occurred in sewer and storm pipe markets where other materials such as claywereoncepredominant. “As mayor, it ismy responsibility toexplore options that will get our rate payers the best bang for the buck. Theopen procurementprocess,allowing thebidding of differentpipe materials,notonly forcedsuppliers tosharpentheirpencils,itendedup savingthecity of Burtonover$2millionby usingPVCpipe instead of ductile iron (DI)pipe on our five-phase $25 million watermain replacement project. Even if we would have chosen to use DIpipe, the open procurement process forced the cost reduction of the DI materials that would havesavedabout$200,000intheproject.” ~Burton(MI)MayorPaulaZelenko Page10
Piping is remarkably inter-changeable and many of today’s modern water systems use a variety of materials. However, many systems restrict themselves to a single mate- rial for all uses (e.g. “all storm pipes must be concrete”) or some categories of use (e.g. “all water pipes 12” and larger must be ductile iron”). These restrictions are often written into a city or county specification or ordinance and prevent engineers and contractors from considering otherwise acceptable materials. Theserestrictions create a ‘closed’ system, while expanding old standards to include alternative materials pro- vides for‘open’competition. A sensible local procurement approach can take advantage of changes in pipe materials not only on a cost basis, but also on their performance characteristics. This section summarizes several consultant studies recently released that examine cost dif- ferentialsofthe major pipematerialsbased onpipesizeandlength. Table2 WHATKINDOFWATERPIPESAREUNDERGROUNDINYOURCITY? Folkman(2018)estimatesthatfourtypesof pipematerialsmakeup91percentofwatermains t$JUJFTPGUFOVUJMJ[FUIFNJODPNCJOBUJPO Theremaining9%ofpipesused tIJHIEFOTJUZQPMZFUIZMFOF()%1&) t TUFFM tNPMFDVMBSMZPSJFOUFE17$(17$0) tDPODSFUFTUFFMDZMJOEFS($4$) tPUIFSNBUFSJBMT Thefourcommonlyusedpipes: tDBTUJSPO($*)28% tEVDUJMFJSPO(%*)28% tQPMZWJOZMDIMPSJEF(17$)22% tBTCFTUPTDFNFOU(A$)13% Source:Folkman,StevenPh.D.,P.E.,(March2018) These studies have found that communities with open procurement policies have been able to lower their costs for purchasing pipes even in cases where the same material is used. In fact, going from a closed to open policy on average can save local governments30percentincapitalcostsonpipe,orroughly $100,000/mile. BCC Research and Datahawks reviewed bid documents and interviewed local water officials in 14 communities (cities and counties). They looked at the use and cost of dif- ferent pipe materials and different lengths of pipe commonly used by cities, notably ductileironandplasticpipe (primarily HDPEandPVC). Hereiswhattheresearchfound: t AOFTUJNBUFE78%PGTZTUFNTBMMPXGPSPOMZPOFUZQFPGNBUFSJBMJODFSUBJOBQQMJDB- tions(“closedcompetition”)leadingtovirtualmonopolies. t 5IFBWFSBHFDPTUUPSFQMBDFESJOLJOHXBUFSQJQFTJOBOiPQFODPNQFUJUJPOwTZTUFN is26%permilelessexpensivethanin“closedcompetition”regions. t FPSTUPSNXBUFS,UIFTBWJOHTGSPNiPQFODPNQFUJUJPOwBWFSBHF39%QFSNJMF. t /BUJPOBMMZ,iPQFODPNQFUJUJPOwDPVMETBWFBOFTUJNBUFE$20.5CJMMJPOGPSESJOLJOH waterand$22.3billionforstormwaterinpipematerialcostsaloneoverthenext 10years. Researchers found evidence of the added cost ‘closed’ procurement policies impose on local governments. The costs result not from any difference of materials, but rather fromadifferenceofprocurementpolicy: “Furthermore, ductile iron pipe of the same diameter was found to be less costly in open bid cities than in closed bid cities:8-inch ductile iron pipe cost, onaverage,$71.69perfootinPortHuron(closed)and$62,39inGrand Rapids Page10
(closed), in comparison to $58.60 in Livonia (open) and 55.64 in Monroe (open). Therefore, even when ductile iron is considered by itself, 8-inch pipe costs in closed bid cities were up to $16.05 higher than in open bid cities, equivalenttoapipecostinflationofupto29%,”(BCC2017). A summarytableincludedintheappendixpresentsselectedinformationforeachof the research reports. The key information includes: pipe material, annual installation in linear feet, pipe diameter and cost per foot, and while the information presented in the studies covers 2013 to 2015, we focus on the 2015 cost per foot information, the latest year of report availability. Reevaluating the status quo and conducting cost comparisons can lead to choices that yield benefit to the community and system users. These findings should be of great interest to local officials that are looking for better options to upgrade their water sys- tems,stretchresourcesandkeepratesdown. Because the savings accrue at the project level, competition will speed the upgrad- ing of water infrastructure and enable innovation to help provide clean, safe water and reduce ongoingmaintenancecosts. PipePerformanceExpectations TheAmericanWaterWorksAssociation(AWWA)andtheAmericanSocietyfor TestingofMaterials(ASTM)establishedouterdiameterwallthicknessstandardsfor pipesmadeofCastIron(CI),DuctileIron(DI),PolyVinylChloride(PVC),HighDensity Polyethylene (HDPE)and Molecularly Oriented Poly Vinyl Chloride (PVCO). Thestan- dardsestablishathresholdofperformancethatallpipesareexpectedtomeet.Thus, pipesthatmeetthesemechanicalperformancecriteria,regardlessofpipematerial, satisfythestandards.Thestandardsarebrokendownbygroupingpipediametersizes. TheAWWA standards have governed outer diameter (OD) sizes for pipes used in municipal water systems since the 1970s. OD pipe size standardization for water systems enable compatibility with connections for valves, hydrants, services and fittings for different pipe materials and assures complete interchangeability with a minimal amount of inventory required for operations and maintenance activities. The outer wall diameter (wall thickness) is the most direct metric of pipe suitability for a project and includes consideration ofhydrostatic design stress(psi). Table3 SOURCE:Anderson,R.2007,USConferenceofMayors Page10
These standards address many concerns such as meeting firefighting requirements: “Fire flow standards require a minimum residual water pressure of 20 pounds per square inch gauge (psig) during flow. It is common practice to maintain pressures of 60 to 75 psig in industrial and commercial areas and 30 to 50 psig in residential areas. Distribution system mains and pipes must be designed to withstand these pressures.” (/BUJPOBMADBEFNJFT1SFTT(64),1982). Why are pipes failing despite established standards for performance? Standards describe the mechanical performance necessary for an application, or in the case of the A/4*//4F614UBOEBSE,UIBUUIFQJQFDPNQMJFTXJUIBMMIFBMUISFHVMBUJPOTGPSNBUFSJBMT that contact drinking water. But pipe standards do not specify what pipe to procure or the environmental factors that may cause a pipe to fail prematurely such as the local soil corrosivity, seismicconditions,oruse. For existingpipe,age is alsoan important factor. There is a growing body of information that characterizes the general decline of infrastructure, and more specifically, breaks in water mains and sewer pipes. The AWWA (2012) released a landmark report on underground infrastructure (pipes) that unveiled the extent of decline and the urgency of addressing it. An AWWA follow-up surveyexpressedthis,“ThetopconcernintheAWWAsurveysfor2016and2017 is ‘renewal and replacement (R&R)’ of aging water and wastewater infrastructure”, (AWWA 2017). Additionally, the American Society of Civil Engineers (ASCE) has opined that water and wastewater infrastructure in America gets a D- grade in 2009, (ASCE 2009); and a slight improvement to a D grade in 2017, (ASCE 2017). The EPA has similar findings. Twosurveysprovidelocal-governmentorientedfindings:a330-citysurveyconduct- ed by the Conference of Mayors, (2007); and, a more recent survey of 308 utilities conductedby Utah StateUniversity,(2018). The Conference of Mayors released results of a 330-city survey examining the status ofassetmanagementandconditionassessmentsofwaterandsewerpipesandpipe failures (Anderson, 2007). The findings demonstrate that pipe breaks are common (See Table3).Assetmanagement programsweremorelikely to be foundinlargersystems. UtahStateUniversityrecentlyreportedresultsfromasurveyofwatermainbreaks, (Folkman,March2018).Thesurveyincluded308drinkingwaterutilitiesintheUSA andCanadawithdetailsfrom281onwatermainbreakdatacovering170,569miles ofpipe.Thissurveyisanimportantcontributiontotheliteraturebecauseitprovides estimatesofpipe performance by typeofpipematerial. Among the major findings of the Utah State University survey, several are important because they directly address pipe performance in general and performance by pipe material (adaptedfromFolkman,March2018): t 8BUFSNBJOCSFBLSBUFTIBWFJODSFBTFE27%GSPN2012UP2018;SBJTJOHGSPN11UP 14breaksonaverageforevery100milesofpipeperyear. t 5IF308XBUFSTVQQMZTZTUFNTTVSWFZFEGPVOEUIBU82%PGDBTUJSPO($*)QJQFTBSF morethan50yearsoldandexperiencinga46%increaseinbreakrates. t ANPOHUIFVUJMJUJFTTVSWFZFE,JUXBTGPVOEUIBUVTJOHBTTFUNBOBHFNFOUBOEPQFSB- tionsoptimization(forexample,pressurereductionandleakdetection),helpextend theusefulassetlife. t 0OMZ45%PG6UJMJUJFTDPOEVDUDPOEJUJPOBTTFTTNFOUPGXBUFSNBJOT. t 17$QJQFIBEUIFMPXFTUGBJMVSFSBUFJOUIFTVSWFZFEVUJMJUJFTDPNQBSFEUPDBTUJSPO, ductileiron,concrete,steelandasbestoscementpipes. t $BTUJSPOBOEEVDUJMFJSPOQJQFTFYQFSJFODFIJHI GBJMVSFSBUFTJODPSSPTJWFTPJMT. t MPTUVUJMJUJFTIBWFNPEFSBUFUPIJHITPJMDPSSPTJPO SJTL. A substantial portion of the current pipe inventory is cast iron and it is nearing the end of its design life. Water and sewer system managers regularly consider whether to repair or replace pipes. If repair, how, where, and for what linear measure? If doing a replacement,alsoconsiderwhatpipematerial hasthebestvalue. Page10
The local government utility surveys confirm the constancy of breaks. Earlier in this report we noted that even with a downturn in pipe expenditures by local government, pipes, the underground infrastructure, and their immediate system connectedness, drains, lines, etc., continue to be among the top annual construction expenditures in the publicwaterandsewersectors. The repetitive nature of the repair and replace procurement activity adhering to entrenched or convenient procurement policies is a direct impediment to cost-savings by stifling innovation. Mayors should instead view it as an opportunity to try new approaches and new pipe materials. If different pipe materials meet recommended mechanical standards, then they should also have equal consideration in an open bid process. This will introduce competition and should result in lower prices, even for incumbent materials. There are many claims and counterclaims about the efficiency, durability and safety of pipes. Local procurement officials can obtain reliable information by contacting vari- ous industry trade associations and state and federal agency resources. Officials can also rely onconsultingengineersforinformation. PUBLICSAFETY AND THE ENVIRONMENT Advances in drinking water treatment technologies have been tremendous since 1900, but the public health benefits are sometimes diminished with pipe failure. Cit- JFTXJUINBjPSVSCBOESJOLJOHXBUFSTZTUFNTMJLF+FSTFZ$JUZ,/+,BBMUJNPSF,M%BOE Louisville,KYimplemented bestpracticesintheearly1900s–filtrationandchlorination – and achieved an immediate decline in infant and childhood morbidity and mortality related to parasitic water borne pathogens. Since then, the invention and incorpora- tion of many new treatment technologies in the late 1900s has further enhanced pub- lic safety. Yetbreakage, which includes corrosions and leaks, of any pipe, regardless of material, has the potential to reintroduce waterborne pathogens to the consumer through infiltration of the pipe. Similarly, breaking sewer pipes and wastewater pipes are a concern for the environment and potential human impact (basement backups andcontaminatedstreams). Chronichealthimpactsareimportanttorecognize,andtheymaybeassociatedwith broken or fully functional pipes. Chronic health impacts have been related to chemicals or contaminants in drinking water that may be carcinogenic. For example, some of the drinking water treatments applied can result in potential public health impacts. The EPA sets drinking water standards that regulate the allowable levels of substances of concern; and, the EPA has an action-forcing mechanism to consider new substances for regulationonaregularbasis. Theliterature on acute and chronic public health impacts from contaminated water iswellestablishedandnottheprimaryconcernofthisreport.Whilesomewhatdated, B/BUJPOBM3FTFBSDI$PVODJMQVCMJDBUJPOQSPWJEFTBHPPEGPVOEBUJPOJOMJTUJOHBOE describingsomeoftheseadversehealthimpactsandtheirdrinkingwatercauses, (/BUJPOBM3FTFBSDI$PVODJM(64)4BGF%SJOLJOH8BUFS$PNNJUUFF.8BTIJOHUPO(%$): 1982). Drinking water safety is important, and it is local government that provides some of the safest drinking water to hundreds of millions of people daily. Providing 24-hour service all the time is an expensive proposition and local government invested over$65billionin2015,andstillitisachallengetoensureuninterruptedservice. Until the late 1980s, EPA was responsible for testing and certifying that materials were safe to be used for both drinking water and waste water pipes. Following a decision by the EPA to no longer do this work, the EPA (through a regulatory process) QBTTFEUIFSFTQPOTJCJMJUZUPUIF/BUJPOBM4BOJUBUJPOFPVOEBUJPO(/4F).4JODFUIFOUIF /4FIBTEPOFBMMPGUIFUFTUJOHBOESFUFTUJOHPGQJQJOHNBUFSJBMTUIBUHPJOUPXBUFS Page11
infrastructure projects. It is important to note that all materials, from the new and inno- vativetothetraditional,aretestedandretestedtoensuretheirsafety. 5IFA/4*//4F614UBOEBSEFOTVSFTUIBUESJOLJOHXBUFSQJQFTBSFTBGFGPSVTFBOE that all pipes are tested for safety equally. The materials are tested before the pipes are used commercially, by subjecting them to multiple tests, including if the pipes leach chemicals or other substances into the water. Once the materials are certified, the test- ing does not stop. Materials used in pipes are continuously tested throughout produc- UJPOCZ/4F.5IFTFBVEJUTBSFEPOFSBOEPNMZUXJDFFBDIZFBSBOEBMTPFOTVSFUIBU qualitycontroltestsarebeingdonebythemanufacturer. TheConferenceofMayorsadoptedpoliciesurgingcitiestoconsiderenvironmental impactsusinglifecycleanalysis(LCA)whenavailableandappropriate.LCAshave becomemore widelyavailable,andtheConferenceofMayorsprovidedanexamplein relationtopipematerials(Anderson,2013).Itisimportantformayorstoweighpublic safety(includingenvironmentalexternalities)aswellascostandperformanceofpipes. Typically,an LCAconsidersseveralstages:production/extraction,constructionpro- cess,use,andendoflife.EachstageofanLCAidentifiesinputsandoutputstoassess energy use, wastes, emissions and their environmental impact. TheLCA provides “… transparentdisclosureofenvironmentalimpactandisusedtostandardizeindustry comparisons”(SustainableSolutionsCorporation,Royersford,PA).Standardizedcom- parisonsprovidea goodtooltoassesscompetingproductclaimstechnicallyandana- lytically. Local procurement officials may have authority torequesttheresultsof an LCAforasinglepipematerialormultiplepipematerials.Thisreportwillnotaddress theclaimsandcounterclaimsonpipematerialenvironmentalimpacts.However,we encouragelocalofficialstoconsider LCAs whenmakingwaterinfrastructuredecisions. Thepipeindustryismovingtowardsprovidingmoretransparentandhigher-quality informationontheirenvironmentalperformancethatmaybeofusetolocalofficials. Forexample,Uni-BellPVCPipeAssociationcommissionedanLCAonpotablewater, gravity stormwater,and sanitarysewerpipesystemsthatwasreviewedin accordance withISO14044(astandardizedreviewprotocolensuringtheaccuracyofanLCA).The LCAledtoaPVCpipeEnvironmentalProductDeclaration(EPD),whichcomplieswith *40 14025TUBOEBSETBOEXBTJOEFQFOEFOUMZDFSUJGJFECZ/4F*OUFSOBUJPOBM. There are many good resources that local officials can use to determine the safety of piping materials and whether or not they are appropriate for their specific project. These safety standards are based on data collected over long periods of time and are reliable. CONCLUSION We reported in our 2013 review of local government water and sewer pipe pro- curement practices that closed procurement that prohibits competition among different pipe materials is prone to inefficiencies and the potential for substantial lost opportunity costs. Cities invest significant resources in water and sewer pipes, then and now. The case for considering alternative pipe materials that might perform as good or better than conventional pipes used today, and cost less, is compelling. In the 2013 report several communities provided anecdotal cases where alternative (PVC) pipe materials were chosen, and cost savings were achieved. A business case approach made pos- sible through open bid procurement was suggested to compare competitive pricing and overall value, and the local procurement official could find assistance from knowl- edgeable consulting engineers, or develop the tools needed to make accurate cost and performance comparisons. Fiveyearslater,2018,thecaseforopencompetitionis stronger.Closedprocurement and low bid policies may be state law in some cases but there is often an opportunity for exception. Whether state law or local policy, the fact is that new information (both knowledgeandanalytictools)oncost,performance,publichealthandenvironmental
impact is readily available. Mayors and their departments can usethis information to lower or stabilize their pipe capital costs while meeting safety and performance requirements. A standardized cost per foot analytical tool such as the BCC and Datahawks research used is of practical utility to local officials who make procurement decisions andseekefficienciesandcostsavings.TheAWWAreportsandFolkman’ssurveymake a compelling case for the magnitude of the challenge to maintain and upgrade the underground infrastructure. Folkman specifically emphasizes the increasing number of local systems making decisions about replacing legacy pipes, such as cast iron, that are agingoutandtheimportanceofcomparingpipecost,performanceandenvironmental impacts when procuring new pipes. These decisions will have a 50 to 100-year design life expectation. Public health impacts are substantially mitigated when potable water pipes are maintained and operated properly. The potential for health impacts increases when pipes fail, and sometimes when treatment and/or biofilm protocols are changed or modified. Pipe failure can result in the introduction of waterborne parasites and inor- ganic elements to the tap. Testing frequently detects organic contaminants in pipes with no- or interrupted-flow. For example, stalled water and residual chlorine in drinking water pipes broken by an earthquake have resulted in detection of tri-halo-methane (THMs) at the tap when service continued. Asset management best practices as well as detection technologycaneffectively address pipe failure. Public safety includes environmental impacts as well as public health. Reports and testing results on all materials used in water infrastructure for public health are widely BWBJMBCMFGPSSFWJFXGSPNBDDSFEJUFEUIJSEQBSUJFT,JODMVEJOH/4F.8FTUBUFEJO2013, and restate here, the use of Life Cycle Analysis helps differentiate the environmental impacts of pipe materials according to a standard method of comparison. Some pipe providers seek additional differentiation through an Environmental Product Declaration, which requires third party verification of ISO certification. This sets a high bar for com- paringenvironmentalimpacts. DiscussionQuestions As this paper points out there is plenty of evidence to show that open procurement andbidprocesses arethefutureof“goodgovernment.”Thebigquestion iswhyisthere still substantial local resistance to making any change? Is the resistance due to a lack of information and training of local procurement officials? Are consulting engineers being allowed tosharenewideasoraretheylimitedbytheexisting norms orlocal/stateordi- nances or laws? Are the cost, performance and safety information presented in a way thatisamenabletolocalprocurementprocesses? Changing behavior relies on changing attitudes, and the transparent and account- able processes of open bid competition can lead the way. Mayors are strategically positionedtoplaytheleadingrole.
REFERENCES American Water Works Association, 2012, Buried No Longer: Confronting Ameri- ca’sWaterInfrastructureChallenge,Denver,CO. American Water Works Association, 2017 State of the Water Industry Report, AWWA, 2017, available from: https://www.awwa.org/publications/opflow/abstract/ articleid/65762696.aspx. American Society of Civil Engineers (ASCE), “2009 Infrastructure Report Card,” available from: https://www.infrastructurereportcard.org/2009/sites/default/files/ RC2009_drinkwater.pdf American Society of Civil Engineers (ASCE), “2017 Infrastructure Report Card,” availablefrom:http://www.asce.org/reportcard/ Anderson, R., March 2013, Municipal Procurement Process Improvements Yield Cost- EffectivePublicBenefits,UntiedStatesConference ofMayors,Washington,DC. Anderson, R., September 2007, National City Water Survey 2007 – The Status of Asset Management Programs in Public Water and Sewer Infrastructure in America’s MajorCities,U.S. Conference ofMayors,Washington,DC. BCC Research, February 15, 2016, Special Research Study: Comparison of Pipe- line Installation Lengths and Costs in Two Cities, prepared for the American Chemistry Council,(BCCResearch,49 Walnut Park,Wellesley,MA). BCC Research, April 23, 2016, Special Research Study: Comparison of Water Main Pipe Installation Lengths and Costs in North and South Carolina: Raleigh, Charlotte, and Spartanburg/Greenville, prepared for the American Chemistry Council, (BCC Research,49 Walnut Park,Wellesley,MA). B$$ 3FTFBSDI, /PWFNCFS 3, 2016, Special Research Study: Comparison of Water Pipe Installation Lengths and Costs in Michigan: Port Huron, Grand Rapids, Monroe, and Livonia, prepared for the American Chemistry Council, (BCC Research, 49 Walnut Park,Wellesley,MA). Datahawks,LLC,December31,2016,SpecialResearchStudy:Comparisonof8” and12”WaterMainPipeInstallationLengthsandCostsinClosedCompetitionand OpenBiddingArkansasCommunities,(Datahawks, LLC,4119LeeAve., LittleRock,AR). BCCResearch,February24,2017,SpecialResearchStudy:NationwidePipeLength andCostSavingsEvaluation,preparedfortheAmericanChemistryCouncil,(BCC Research,49WalnutPark,Wellesley,MA). Folkman Ph.D., P.E., Steven, (March 2018), Water Main Break Rates In the USA and Canada: A Comprehensive Study - An Asset Management Planning Tool for Water UtilitiesWaterMainBreakRatesIntheUSAandCanada. Mack EA, Wrase S (2017) A Burgeoning Crisis? A Nationwide Assessment of the GeographyofWaterAffordabilityintheUnitedStates. /BUJPOBMADBEFNJFT1SFTT(64),1982,DrinkingWaterandHealthVolume4. /BUJPOBM3FTFBSDI$PVODJM(64)4BGF%SJOLJOH8BUFS$PNNJUUFF.8BTIJOHUPO(%$): *4B/-10:0-309-03198-2 /4F *OUFSOBUJPOBM,2015, Product Potable Water, Gravity Storm Water, and Sanitary SewerPipeSystemsDateofIssueMay15,2015PeriodofValidity5YearsDeclaration /VNCFS&1%10047 &1%1SPHSBN0QFSBUPS/4F*OUFSOBUJPOBM789/.%JYCPSP3E.AOOASCPSM*48105 USAwww.nsfsustainability.org. Sustainable Solutions Corporation, Evaluating Life Cycle Assessments for Under- groundInfrastructure,Royersford,PA,www.sustainablesolutionscorporation.com. United States Government Accountability Office, September 2016, Water Infra- structure: Information on Selected Midsize and Large Cities with Declining Populations. GAO 16-785.
APPENDIX: BCCRESEARCHANDDATAHAWKS SUMMARYFINDINGS OhioCommunities The two Ohio communities with closed bid systems paid average cost 32%-35% higher per foot for pipe ($51.83), compared to the one open bid county that had a nearevenblendofDIandplasticpipe($33.33). CarolinaCommunities The one open bid community procured a near even blend of DI and plastic and had categoricallylowercost exceptforSpartanburg/Greenville4”to6”pipe.For12”pipe, closedsystemspaidanadditional50%markup($57.73perfootcompared to$28.21). MichiganCommunities TwoopenbidcommunitiesinMichiganutilizedDIandplasticblends,andwherethe blend was near even the cost was considerably lower than the two no bid communities using DI only. The report also found clear evidence of the added cost ‘closed’ procure- mentpoliciesimposeonlocalgovernments: “Furthermore, ductile iron pipe of thesame diameter was found tobe less costly inopenbidcitiesthaninclosedbidcities:8-inchductileironpipecost,onaverage, $71.69 per foot in Port Huron (closed) and $62,39 in Grand Rapids (closed), in com- parison to $58.60inLivonia(open)and55.64inMonroe(open). Therefore,even when ductileironisconsideredbyitself,8-inchpipecostsinclosedbidcitieswereupto $16.05 higher than in open bid cities, equivalent to a pipe cost inflation of up to 29%.” Michiganalsodemonstratedsimilarsavings,withclosedsystemspaying27%to 34%moreincapitalcosts. ArkansasCommunities Arkansas communities exhibit some cost complexity. The one open bid community procured plastic pipe, but DI pipe in one of the closed bid communities was slightly lesscostly. The other two closed communities procuring DI pipe had a cost nearly twice that of plastic,exceptfor8”pipe procured inHot Springs.
OHIOCOMMUNITIES NEIGHBORHOODS Reference-BCC,February15,2016 CAROLINACOMMUNITIES Reference-BCC,February15,2016
MICHIGANCOMMUNITIES Reference–BCCResearch,November3,2016 ARKANSASCOMMUNITIES LOCALUNITOPEN-BIDCITY PIPEMATERIAL 2015AVERAGECOST PERFOOT PIPEDIAMETER (INCHES”) $161.71 12” LITTLEROCK,NORTHLITTLEROCK,SHERWOOD,MAUMELLE $1.76MILLIONINVESTMENT 30,021FEETOFPIPEINSTALLED
TheMayorsWaterCouncil TheMayorsWaterCouncil(MWC)assistslocalgovernmentsinprovidinghigh qualitywaterresourcesinacost-effectivemanner. MWCprovidesaforumforlocalgovernmentstoshareinformationonwater technology,managementmethods,operationalexperience,andfinancingof infrastructuredevelopment. MWCmonitorsandrespondstofederallegislative,regulatoryorpolicy proposalsaffectingthedeliveryofmunicipalwaterservices. MWC also providesa forumtoassistlocalgovernmentsin exploring competitionandpublic-privatepartnershipapproaches,andalternative methodsoffinancingwaterinfrastructuredevelopment. MayorsWaterCouncilCo-Chairs2018 MayorJillTechel,CityofNapaCA MayorDavidBerger,CityofLimaOH
THEUNITEDSTATESCONFERENCEOFMAYORS 1620EyeStreet,NW Washington,DC20006 Tel:202-293-7330 Fax:202-293-2352 usmayors.org