1 / 13

Technological Advancements

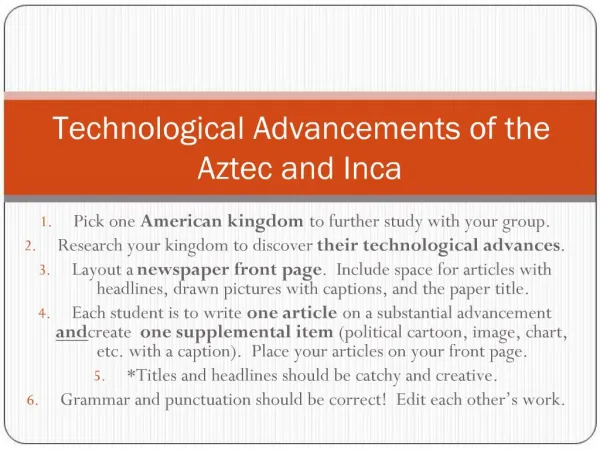
Technological Advancements refer to the development and refinement of tools, systems, devices, and methods that improve human life and solve problems more efficiently. They span across various fields, from communication and medicine to transportation and energy, continually transforming how people interact with the world.

Maheswari7
Download Presentation

Technological Advancements

An Image/Link below is provided (as is) to download presentation Download Policy: Content on the Website is provided to you AS IS for your information and personal use and may not be sold / licensed / shared on other websites without getting consent from its author. Content is provided to you AS IS for your information and personal use only. Download presentation by click this link. While downloading, if for some reason you are not able to download a presentation, the publisher may have deleted the file from their server. During download, if you can't get a presentation, the file might be deleted by the publisher.

E N D

Presentation Transcript


  1. Journal of Science and Technology ISSN: 2456-5660 Volume 8, Issue 07 (July -2023) www.jst.org.in DOI:https://doi.org/10.46243/jst.2023.v8.i07.pp64 - 76 Hydrogeological condition in the Newaj Watershed using thematic layers generated by the spatial Data. Syed Akram Aliand H. U. Usmani Dept. of Geology, Govt. M.V.M. Bhopal, M.P. email: akram.mpcost@gmail.com To Cite this Article Syed Akram Aliand H. U. Usmani, “Hydrogeological condition in the Newaj Watershed using thematic layers generated by the spatial Data.” Journal of Science and Technology, Vol. 08, Issue 07,- July 2023, pp64-76 Article Info Received: 27-06-2023 Revised: 29-06-2023 Accepted: 11-07-2023 Published: 18-07-2023 Abstract The present study is an attempt to describe the hydrogeological condition of Newaj Watershed of Rajgarh District, Madhya Pradesh, by the themes generated using spatial data such as geology, geomorphology, lineament, drainage, and landuse / landcover maps. The geological map corealeted with field data show that the basic volcanic rocks present in the area have no primary porosity but because of weathering and due to presence of fractures and joints a secondary porosity has been developed which favours the movement and accumulation under the surface. Similarly presence of surface landform also favour the groundwater conditions as the landform like Pediplain, pediments and deeply weathered plateau seems primarily favourable site for groundwater percolation and accumulation. Lineaments density, drainage texture and present landuse/landcover also favour the groundwater movement and accumulation hence, the analysis of these themes give primary information regarding hydrological study which may be used before detailed investigations for groundwater. Introduction Study of surface and sub-surface water resources is an important aspects and covered under the branch of geology named as “hydrogeology” it covers the occurrence, movement and distribution of water in the sub-surface layers. This concept of occurrence and movement of water is valuable as it gives idea regarding the distribution of water beneath the surface. Understanding of occurrence and distribution is important because it may be used as guide to explore the groundwater resources. In the present rapid advancing society where demographic, agricultural and industrial grouths have become Published by: Longman Publishers www.jst.org.in Page | 64

  2. Journal of Science and Technology ISSN: 2456-5660 Volume 8, Issue 07 (July -2023) www.jst.org.in DOI:https://doi.org/10.46243/jst.2023.v8.i07.pp64 - 76 a need of the mankind, the other very important fact of this growing world is need of water. Because any growth is impossible without availability of clean and good, usable quality of water. Water, as a matter of fact, available both as surface as well as sub-surface resources. Surface resources are not available everywhere where as the underground / sub-surface resources available almost everywhere. because more and more water is being withdrawn from the groundwater resources which creating an over exploitation of these resources. This over exploitation causing depletion of available resources of sub-surface / groundwater. This creates a pressure on the available resources and emphasizes the need to explore new groundwater resources, as groundwater is store beneath the earth surface in pervious zones these pervious zones are mostly secondary in nature and remain present in the form of joints, cracks and fracture in the rocks. Thus geology, structures and linear feature, geomorphology collectively control this distribution, occurrence and movement of throw them. Therefore it seems more reasonable to delineate these themes by the visual interpretation of spatial data as they may provide information regarding the occurrence, movement and distribution of sub-surface resource (Machiwal et al. 2011; Mallick et al. 2014). In the present study various themes generated through spatial data like geology, geomorphology, landuse/landcover and lineament map have been analysed to understand a tentative hydrogeological condition of the present study area which may be used to have an idea regarding the groundwater conditions of the watershed. Study Area The area of present study is Newaj watershed around Newaj river originated from place Dev Badla Sehore district and flows around Rajgarh district of Madhya Pradesh. The study area falls on SOI Topo Maps . 54 D/11, 54 D/12, 54D/15, 54 D/16, 54 A/9 and 55 A/13 and bounded between longitude 76o36’45” to 76o53’00” East and latitudes 23o50’00”to 24o16’52” North. . The area is represented an undulating topography. The basalt is covered by B.C. Soil formed as a product of weathering. Published by: Longman Publishers www.jst.org.in Page | 65

  3. Journal of Science and Technology ISSN: 2456-5660 Volume 8, Issue 07 (July -2023) www.jst.org.in DOI:https://doi.org/10.46243/jst.2023.v8.i07.pp64 - 76 Fig. 1 Location map of the Newaj Watershed Published by: Longman Publishers www.jst.org.in Page | 66

  4. Journal of Science and Technology ISSN: 2456-5660 Volume 8, Issue 07 (July -2023) www.jst.org.in DOI:https://doi.org/10.46243/jst.2023.v8.i07.pp64 - 76 Methodology The steps of methodology in this study involves the preparation of geological, geomorphological, linear feature (lineaments), drainage and landuse/landcover layers by the visual interpretation of remotely sensed data and for their referencing in the field as well as on the GIS platform and topomaps also used. All the maps prepared at 1:50000 scale as the geocoded IRS Liss III FCC images were used. The rock formations exposed in the area where interpreted by their colour, tone, texture, pattern, etc. and physically verified in the field and necessary corrections incorporated in this interpreted map. Geomorphological map also visually interpreted and the help of topomaps also taken. The % area covered by each landform also delineated by ARcGIS software and tabulated. Drainage map also prepared by visual interpretation technique and interpreted to decipher the hydrogeological conditions. Lineament map interpreted by the remote sensing data and with the help of this map a lineament density map also prepared using GIS software. As existing landuse / landcover also directly or indirectly supports the water circulation at surface as well as under the surface. Hence landuse / landcover map of the area is prepared and divided into various laduse / landcover classes and the area covered by each landuse / landcover has been worked out through GIS and Listed in a table and discussed in hydrogeology. All these maps verified in field and interpreted to assess the groundwater conditins of the present watershed and attempt is made to describe the hydrogeology of the area under study. The image interpretation keys used for satellite data analysis are as under- Table. 1 Image Interpretation Keys for Satellite Data Analysis Image Element Description Tone/Texture Due to variation in reflection of object, different tone/texture is displayed on the image which helps on differentiation of type of litho unit, soil, landuse/landcover etc. tone colour composite data has used, only color accounted in the study. Texture It is frequency of change and arrangement of tone/color in the image. Different type of textures like smooth, fine, rough, rippled, mottled etc. enables the interpretation. Shape This helps in identification of certain geomorphic unit, structure, landuse/landcover and consideration of scale of image. Size The size of an object is very useful in various geomorphic units like discrimination of cuesta and hogback, plateau, mesa, butte, based on the size consideration of the scale of imagery, other objects related to land cover also identified with the help of size. Published by: Longman Publishers www.jst.org.in Page | 67

  5. Journal of Science and Technology ISSN: 2456-5660 Volume 8, Issue 07 (July -2023) www.jst.org.in DOI:https://doi.org/10.46243/jst.2023.v8.i07.pp64 - 76 Pattern Pattern or spatial arrangement of object gives the clue about origin of geological feature; particular pattern has relation with the underlying lithology, structure, hydrologic characteristics and soil texture which helps in identification of these features. Site/Location This association of an object like soil, vegetation, drainage, geology and geomorphology have bearing on the association and helps in the interpretation. Drainage Gives the clues about variation in composition of rock types and slope density condition. Drainage pattern Gives the clues about Geology, Structure and Geomorphology of area. Landforms Help in identification of the lithounits and climate conditions of the area. Trend Gives clue about deposition, orientation, secondary porosity and permeability line/Structure of rock. Dip/Slope Helps in assessment of runoff, orientation of rocks and structures present. Result and Discussion To assess the hydrogeological conditions the following thematic layers generated and interpreted and their influence on groundwater conditions is give here as below- Geological map –Geological map includes various litho units and contacts between rock units. In the present study the geological map interpreted from remote sensing data and District Resource Map (GSI, 2002) and categorized into alluvium, weathered basalt and compact basalt. The basalts are of Deccan Trap activity and identified as flows stratigraphically the flows belong to Malwa Traps and has been divided into Indore formation, Kankariya – Perukheri formation, Kalisindh formation and Mandleshwer formation. During study it is observed that these flows are Aa type, Pahoehoe and Compound type of flows. These flows are weathered jointed and at some places columnar joints also observable (Fig.2). Hydrogeologically, the porosity and permeability are the necessary characters play crucial role in circulation and accumulation of groundwater. In basalt primary porosity is not found but secondary porosity develops due to weathering and jointing as these joints if, continued upto great depth act as channel ways to percolate the rain water down into the pervious zones. As it is observed during field study, the area with highly jointed and fractured rocks show good accumulation of groundwater. Hence, it seems that the more weathered or fractured and jointed rocks are good site for concentration of groundwater and may be treated as potential sites. Published by: Longman Publishers www.jst.org.in Page | 68

  6. Journal of Science and Technology ISSN: 2456-5660 Volume 8, Issue 07 (July -2023) www.jst.org.in DOI:https://doi.org/10.46243/jst.2023.v8.i07.pp64 - 76 Fig. 2 Lithological map of the Newaj Watershed Published by: Longman Publishers www.jst.org.in Page | 69

  7. Journal of Science and Technology ISSN: 2456-5660 Volume 8, Issue 07 (July -2023) www.jst.org.in DOI:https://doi.org/10.46243/jst.2023.v8.i07.pp64 - 76 Geomorphological map –Geomorphological map embraces the surface landforms, most surface landforms also favours the accumulation of rain water to become groundwater and therefore serve as good site for groundwater accumulation for the preparation of geomorphological map of present watershed the SOI Topomaps and remotely sensed LISS III image used and digitized on 1:50000 scale (Fig.3) the map reveals the presence of landorms namely Highly Disected Plateau, Moderately Disected Plateau, Weathered Plateau, Residual Mound, Pediment, Pediplain,River Valley and Channel bar. The area covered by these landforms as calculated using GIS software is shown in the Table 2- Table 2 Geomorphic Features and their Areal Extent S.No. Geomorphology Area (sq.km.) Percent 1 Pediplain 224.45 38.15 2 Pediment 13.96 2.37 3 Channel Bar 0.16 0.03 4 Plateau 313.73 53.32 5 Residual Mound 0.42 0.07 6 Valley 20.25 3.45 7 Waterbody 15.38 2.61 Grand Total 588.35 100 Geomorphological character of an area affects the hydrological conditions. Integration of geomorphology with hydrological characters prvides a simple way to understand the groundwater occurrence (Siva et al, 2017). A perusal of geomorphic map of the area shows that most of the area is occupied by weathered plateau is present in central portion extending north – south and cover 53.3% of the total area. Next landform feature is pediplain (38.1%) occupy mostly the southern as well as northern side of watershed. Both the dugwell and tubewell in this landform, show that the depth of dugwell range 10 – 15 meters and tubewell it is between 100 – 120 meter. The yield of bore / tubewell is 25-100 liters/min. Pdeiment cover the area2.37% of the total area and because of less weathering intensity the expected yield is 25-50 lpm. Published by: Longman Publishers www.jst.org.in Page | 70

  8. Journal of Science and Technology ISSN: 2456-5660 Volume 8, Issue 07 (July -2023) www.jst.org.in DOI:https://doi.org/10.46243/jst.2023.v8.i07.pp64 - 76 Fig. 3 Geomorphological map of the Newaj Watershed Published by: Longman Publishers www.jst.org.in Page | 71

  9. Journal of Science and Technology ISSN: 2456-5660 Volume 8, Issue 07 (July -2023) www.jst.org.in DOI:https://doi.org/10.46243/jst.2023.v8.i07.pp64 - 76 Lineament map –As linear feature lineament are also important, as these are large continued fractures result due to stresses caused by different forces, deformational as well as other reasons like cooling and contration. Lineament serve as condutes and provide a valuable insight into the groundwater movement (Pradeep et al.,1996). The lineament map generated (Fig.4) and lineament density ma also generated (Fig.5) and interpreted in terms of their concentration in association of groundwater conditions. These maps reveal a good groundwater condition in the areas of high lineament frequency zones. Groundwater levels recorded in the high lineament density reveal good groundwater condition in this area. Fig. 4 Lineament map of the Newaj Watershed Published by: Longman Publishers www.jst.org.in Page | 72

  10. Journal of Science and Technology ISSN: 2456-5660 Volume 8, Issue 07 (July -2023) www.jst.org.in DOI:https://doi.org/10.46243/jst.2023.v8.i07.pp64 - 76 Fig. 5 Lineament Density map of the Newaj Watershed Published by: Longman Publishers www.jst.org.in Page | 73

  11. Journal of Science and Technology ISSN: 2456-5660 Volume 8, Issue 07 (July -2023) www.jst.org.in DOI:https://doi.org/10.46243/jst.2023.v8.i07.pp64 - 76 Landuse / Landcover map –this map define the land use pattern of the area and the cover present over the surface. Landuse / Landcover like agriculture, built up, fellow as well as the natural cover like waterbodies, forest, rocky and so on. These parameters directly or indirectly effect the groundwater conditions. Agriculture influence the groundwater storage as crop needs water for irrigation however agricultural land are good site to groundwater recharge. Forest land is good area for water level vise. The study area is almost covered by agricultural land as agriculture is the occupation in which most of the agriculture is groundwater dependent. The landuse / landcover map of present area is shown as Fig. 6 and the percentage wise land use / land cover units are tabulated below- Table. 2 Landuse / Landcover Features and their Areal Extent S.No. Luanduse Area (sq.km.) Percent 1 Agriculture Land 300.21 51.07 2 Built Up 10.75 1.83 3 Forest 44.22 7.52 4 Minning / Querry / Dump 0.55 0.09 5 Wastelands 206.35 35.10 6 Water Body 25.75 4.38 Grand Total 588.35 100 Fig. 6 Landuse / Landcover map of the Newaj Watershed Published by: Longman Publishers www.jst.org.in Page | 74

  12. Journal of Science and Technology ISSN: 2456-5660 Volume 8, Issue 07 (July -2023) www.jst.org.in DOI:https://doi.org/10.46243/jst.2023.v8.i07.pp64 - 76 Drainage map– Drainage is reflection of flow of water at surface and develops as a network. Drainage pattern is influenced by lithology, structures, slope, landcover and soil type. Drainage analysis in quantitive manner is known as morphometry (Horto, 1945). Drainage pattern prevailing in the basin have been demarked using Topomaps and remote sensing image and is depicted in Fig. 7. The prevailing drainage pattern of the area is dendritic and its texture rveals that the water flowing through these drainages have long standing time where slope is gentle hence, it support rain water to percolate and augment the groundwater. Fig. 7 Drainage map of the Newaj Watershed Published by: Longman Publishers www.jst.org.in Page | 75

  13. Journal of Science and Technology ISSN: 2456-5660 Volume 8, Issue 07 (July -2023) www.jst.org.in DOI:https://doi.org/10.46243/jst.2023.v8.i07.pp64 - 76 Conclusion –The present study is an attempt to work out the groundwater conditions through the thematic layers generated using spatial data. The attempt clearly indicates that the spatial data in the form of remote sensing, GIS provides a synoptic coverage of area in consideration providing better picture. Study also reveals that the understanding of geology along with field observation provide information regarding the occurrence of groundwater. Analysis of present landforms also give valuable insight in the groundwater occurrence as most of landform features support rainwater percolation downward and ultimately support to enhance the groundwater. However, some of the landforms do not support rain water percolation and they are to be managed by some selective measures to be applied. Similarly, lineament and lineament density maps, landuse / landcover mao and drainage map also provide information regarding the hydrological condition of the basin. Hence, it is worthy to note that before conducting any exploration programme these themes may be analysed to have an idea about the hydrogeological conditions. Refrences Siva, G; N, Nasir; R. Selvakumar; (2017) IOP Confrence Series : Earth and Environmental Science. 800/2063. Machliwul, D.; Jha, M. K.; Malm B. C.; (2011) Assessment of groundwater potential in Semi Arid Region of India using Remote Sensing, GIS Technique. Water Resource Manage, 25:1359-1386. Mallick, J,; Sing, C. K.; Al wadi, H.; Rahma, A.; Shastri, S.; Mukharjee, S.; (2014) Geospatial and Geostatical approach for groundwater potential zone delineation. Hydrol. Process. District Resource Map (2002) Geological Survey of India. Todd, D.K.; (1980) Groundwater Hydrology, John willey & Sons. Iswara, G. S.; (2006) groundwater prospecting in a hard rock terrain using RS and GIS Unpublished M.Sc. Tech Dissertation, Anna Malai University. Pradeep, R.; Nandulal, L. and Soni, G. K. (1996). Nature of aquifer in parts of granitic terrain in Mahabubnagar District, Andhra Pradesh. Journal of Geological Society of India, Online archive from V. 148(3), pp. 299-307. Horton, R.E. (1945).Erosional development of streams and their drainage basin; Hydrophysical approach to quantitative morphology. Geol. Soc. Amer. Bull. 56, pp. 275-370. Published by: Longman Publishers www.jst.org.in Page | 76

More Related