Download

1 / 23
240 likes | 783 Views
The representation of convection in the Unified Model at 1.5km to 50m gridlength. Kirsty Hanley, Humphrey Lean. Introduction. Kilometre-scale NWP models have provided a step change in our ability to forecast on smaller scales. Particularly for convection .

E N D
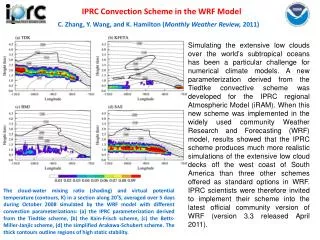
The representation of convection in the Unified Model at 1.5km to 50m gridlength Kirsty Hanley, Humphrey Lean
Introduction • Kilometre-scale NWP models have provided a step change in our ability to forecast on smaller scales. Particularly for convection. • The Met Office currently run a 1.5km gridlength model over the UK (UKV) with convection handled explicitly. • However these grid lengths are still unable to fully resolve the individual convective elements. As a result: • Sometimes see a delay in initiation of convection • Too few smaller lighter showers • Too many heavy “blobby” cells • Often miss organisation UKV Example of surface rain rate from the operational UKV and the radar-derived surface rainfall composite.
Introduction • What will be the benefits of even higher resolution models? • Model dynamics will better resolve some phenomena such as convergence lines, convection • Benefit from higher resolution data (orography, land use, radar observations) • Higher resolution models will inevitably be considered as computer power increases. • Need to understand model behaviour as a function of gridlength. Example of surface rain rate from the operational UKV, a 100m research model and the radar-derived surface rainfall composite.
Convection in sub-km models • Models start to resolve turbulence below 500m – leads to definite changes in behaviour. • Sub-km models improve some aspects (e.g. initiation time, distribution of rainrates) but have problems – in particular tend to produce too narrow showers when they should be larger. • DYMECS results show updrafts from the UKV are too wide – convective updrafts fit best to 200m model but continue collapsing to 100m with no sign of convergence. • So in 200m model updrafts may be about right but clouds too narrow – not filling in gaps between updrafts. May be due to dynamics (mixing, downdrafts) or microphysics. • However all of above is to be treated with caution because behaviour of model very sensitive to subgrid mixing.
The London Model – nested within the UKV PS38 configuration • Mirrors UKV configuration except MORUSES not currently used. • Primarily used for fog forecasting, where it has been shown to have improved performance compared to the UKV (Boutle et al. 2016, QJ). • Is convection also better represented? • Some aspects improved (initiation time, rainrate distribution) but small size doesn’t allow features to spin-up. Cloud depths tend to follow UKV (and are too shallow). • Do we need a larger domain?
Nested model setup – Regional Atmosphere 1.0 (RA1) PS38 configuration For analysis all data is regridded to the 1.5km UKV grid.
RA1 – two versions:RA1-M (Mid-latitude) & RA1-T (tropical) RA1T has more mixing than RA1M… RA1M compensating for UK storms being under-resolved at 1.5km! Bush et al. (2019), GMD: https://www.geosci-model-dev-discuss.net/gmd-2019-130/
The 3D radar composite • The UK radar network consists of 18 C-band (5.3cm wavelength) radars. • Operate in PPI scanning mode (5 PPIs / 5 minutes) with a max range of 255km and minimum of 4 elevation angles. • The Met Office routinely produce a 3D radar composite from the network . • The data is produced on a 1 x 1 x 0.5 km grid (12km top). • Although lower resolution than CAMRa, the data covers the entire UK and is readily available. • Storm reconstructions comparable to CAMRa(Stein et al, in prep). • Use height at which reflectivity falls below 0 dBz as an indicator for cloud top – assuming a minimum layer of 500m.
Assessing storm depth – composite of 6 cases RA1M • 2D histograms of 0 dBZ echo top height against storm diameter. • Storms identified using a height threshold of 3.5km and minimum area of 4 UKV grid boxes. • All models miss deepest storms. • The UKV has too many large diameter shallow storms. • The LM has too many small diameter shallow storms. • The 300m model also has too many small, shallow storms but slightly deeper storms than the LM.
RA1 case study - 1800 UTC 1 June 2018 RA1M RA1T
Sub-km models produce too many wide-spread small showers. This is worse in RA1M (less diffusion).
Cell stats – 1 June 2018 • Storms identified using a rainrate threshold of 1 mm/hr and minimum 4 1.5km grid boxes RA1M RA1T
Assessing storm structure – 1 June 2018 • Mean storm diameter against height for all storms with tops above 3.5 km. • All models miss deepest storms – UKV storms too large. • The 300m and 100m models also miss the deepest storms but have storms getting ~1 km deeper than the UKV and LM. RA1T RA1M Radar UKV LM Radar UKV LM 100m 55m 100m 55m 300m 300m
Initiation time – 1 June 2018 RA1M RA1T • Previously UKV tended to initiate convection ~1 hour too late – with RA1M now often too early but RA1T too late. • Sub-km models initiate too early (even without stochastic BL perturbations). • RA1T generally produces less rain than RA1M. RA1M - perturbations RA1M + RA1T mixing
Coming soon to RA2… Domain-average rainfall Leonard/tilting term Smagorinsky RA1M RA1M + Leonard
Conclusions so far… • The UKV misses the deepest storms. • The London Model has slightly deeper storms but still misses the deepest storms. • The 300m and 100m models also miss the deepest storms but have storms getting ~1 km deeper than the UKV and LM. • The enhanced mixing in the RA1T configuration is better suited to the sub-km models as convection is better resolved. • The RA1M configuration is better suited to models where convection is poorly resolved. • The Leonard terms help reduce domain-average rainfall by reducing the number of grid points with high rainfall rates.
Future Work • Run more cases with larger 300m model and 100m model. • Why are model storms too shallow? Look at profiles. • Storm lifetime? DYMECS suggested UKV storms were too long-lived, is it better at 300m? • Test a variable resolution London model – this would allow the boundaries to be moved further away from the area of interest (e.g. LHR) for cheaper cost. • Impact of physics changes: • 3D TKE scheme. • RA2. • Scale-aware convection scheme.
Dry convective BL - 30th Sept 2011 Vertical velocity spectra at 190m height Change in behavior below 500m - starting to resolve turbulence. Εf BT Tower observatons 500m 100m 50m Turbulence grey zone! f Hz Humphrey Lean BT Tower data courtesy Janet Barlow
Reflectivity vs QCL+QCF The height of the 0 dBz contour agrees well with the height at which cloud ice + liquid falls to zero.
1 June 2018 – RA1M with RA1T BL settings The shape of the profiles are similar to the RA1M profiles. This suggests the cloud scheme PC2 is responsible for the odd shape profiles in the RA1T runs.
BL variability • The UKV simulation with perturbations has more variability than the UKV simulation without perturbations. • By dx = 300m the perturbations project onto scales (i.e. 8x300m=2.4km) that are too small to be relevant to shower generation in this case.