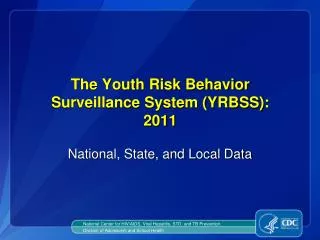
The Youth Risk Behavior Surveillance System (YRBSS): 2009
The Youth Risk Behavior Surveillance System (YRBSS): 2009 . National, State, and Local Data. 2009 YRBS Results Dietary Behaviors. Percentage of High School Students Who Ate Fruit or Drank 100% Fruit Juices Two or More Times/Day,* by Sex † and Race/Ethnicity, ‡ 2009.

The Youth Risk Behavior Surveillance System (YRBSS): 2009
E N D
Presentation Transcript
The Youth Risk Behavior Surveillance System (YRBSS):2009 National, State, and Local Data
Percentage of High School Students Who Ate Fruit or Drank 100% Fruit Juices Two or More Times/Day,* by Sex† and Race/Ethnicity,‡ 2009 * During the 7 days before the survey. † M > F ‡B > W National Youth Risk Behavior Survey, 2009
Percentage of High School Students Who Ate Fruit or Drank 100% Fruit Juices Two or More Times/Day,* 1999 – 2009† * During the 7 days before the survey. † Decreased 1999-2005, increased 2005-2009, p < 0.05. National Youth Risk Behavior Surveys, 1999–2009
Range and Median Percentage of High School Students Who Ate Fruit or Drank 100% Fruit Juices Two or More Times/Day,* Across 39 States and 19 Cities, 2009 * During the 7 days before the survey. State and Local Youth Risk Behavior Surveys, 2009
Percentage of High School Students Who Ate Fruit or Drank 100% Fruit Juices Two or More Times/Day,* 2009 21.3% - 26.7% 26.8% - 28.3% 28.4% - 31.7% 31.8% - 36.0% No Data * During the 7 days before the survey. State Youth Risk Behavior Surveys, 2009
Percentage of High School Students Who Ate Fruit or Drank 100% Fruit Juices Two or More Times/Day,* 2009 Seattle Boston Milwaukee New York City Detroit Philadelphia Chicago San Francisco 24.7% - 32.0% Clark County 32.1% - 33.4% Memphis 33.5% - 34.8% Los Angeles San Bernardino Charlotte- Mecklenburg County 34.9% - 39.3% San Diego No Data Dallas Duval County Orange County Palm Beach County Broward County Miami-Dade County * During the 7 days before the survey. Local Youth Risk Behavior Surveys, 2009
Percentage of High School Students Who Ate Vegetables Three or More Times/Day,* by Sex† and Race/Ethnicity, 2009 * Green salad, potatoes (excluding French fries, fried potatoes, or potato chips), carrots, or other vegetables during the 7 days before the survey. † M > F National Youth Risk Behavior Survey, 2009
Percentage of High School Students Who Ate Vegetables Three or More Times/Day,* 1999 – 2009† * Green salad, potatoes (excluding French fries, fried potatoes, or potato chips), carrots, or other vegetables during the 7 days before the survey. † No change 1999–2009, p < 0.05. National Youth Risk Behavior Surveys, 1999–2009
Range and Median Percentage of High School Students Who Ate Vegetables Three or More Times/Day,* Across 36 States and 17 Cities, 2009 * Green salad, potatoes (excluding French fries, fried potatoes, or potato chips), carrots, or other vegetables during the 7 days before the survey. State and Local Youth Risk Behavior Surveys, 2009
Percentage of High School Students Who Ate Vegetables Three or More Times/Day,* 2009 8.0% - 10.9% 11.0% - 12.3% 12.4% - 14.2% 14.3% - 16.7% No Data * Green salad, potatoes (excluding French fries, fried potatoes, or potato chips), carrots, or other vegetables during the 7 days before the survey. State Youth Risk Behavior Surveys, 2009
Percentage of High School Students Who Ate Vegetables Three or More Times/Day,* 2009 Seattle Boston Milwaukee New York City Detroit Philadelphia Chicago San Francisco 9.3% - 11.0% Clark County 11.1% - 13.5% Memphis 13.6% - 15.5% Los Angeles San Bernardino Charlotte- Mecklenburg County 15.6% - 16.9% San Diego No Data Dallas Duval County Orange County Palm Beach County Broward County Miami-Dade County * Green salad, potatoes (excluding French fries, fried potatoes, or potato chips), carrots, or other vegetables during the 7 days before the survey. Local Youth Risk Behavior Surveys, 2009
Percentage of High School Students Who Ate Fruits and Vegetables Five or More Times/Day,* by Sex† and Race/Ethnicity,‡ 2009 * 100% fruit juices, fruit, green salad, potatoes (excluding French fries, fried potatoes, or potato chips), carrots, or other vegetables during the 7 days before the survey. † M > F ‡B > W, H National Youth Risk Behavior Survey, 2009
Percentage of High School Students Who Ate Fruits and Vegetables Five or More Times/Day,* 1999 – 2009† * 100% fruit juices, fruit, green salad, potatoes (excluding French fries, fried potatoes, or potato chips), carrots, or other vegetables during the 7 days before the survey. † Decreased 1999–2005, no change 2005-2009, p < 0.05. National Youth Risk Behavior Surveys, 1999–2009
Range and Median Percentage of High School Students Who Ate Fruits and Vegetables Five or More Times/Day,* Across 36 States and 17 Cities, 2009 * 100% fruit juices, fruit, green salad, potatoes (excluding French fries, fried potatoes, or potato chips), carrots, or other vegetables during the 7 days before the survey. State and Local Youth Risk Behavior Surveys, 2009
Percentage of High School Students Who Ate Fruits and Vegetables Five or More Times/Day,* 2009 13.7% - 16.5% 16.6% - 18.3% 18.4% - 20.6% 20.7% - 24.4% No Data * 100% fruit juices, fruit, green salad, potatoes (excluding French fries, fried potatoes, or potato chips), carrots, or other vegetables during the 7 days before the survey. State Youth Risk Behavior Surveys, 2009
Percentage of High School Students Who Ate Fruits and Vegetables Five or More Times/Day,* 2009 Seattle Boston Milwaukee New York City Detroit Philadelphia Chicago San Francisco 17.5% - 18.2% Clark County 18.3% - 22.5% Memphis 22.6% - 23.5% Los Angeles San Bernardino Charlotte- Mecklenburg County 23.6% - 26.1% San Diego No Data Dallas Duval County Orange County Palm Beach County Broward County Miami-Dade County * 100% fruit juices, fruit, green salad, potatoes (excluding French fries, fried potatoes, or potato chips), carrots, or other vegetables during the 7 days before the survey. Local Youth Risk Behavior Surveys, 2009
Percentage of High School Students Who Drank Three or More Glasses/Day of Milk,* by Sex† and Race/Ethnicity,‡ 2009 * During the 7 days before the survey. † M > F ‡W > H > B National Youth Risk Behavior Survey, 2009
Percentage of High School Students Who Drank Three or More Glasses/Day of Milk,* 1999 – 2009† * During the 7 days before the survey. † Decreased 1999–2009, p < 0.05. National Youth Risk Behavior Surveys, 1999–2009
Range and Median Percentage of High School Students Who Drank Three or More Glasses/Day of Milk,* Across 39 States and 18 Cities, 2009 * During the 7 days before the survey. State and Local Youth Risk Behavior Surveys, 2009
Percentage of High School Students Who Drank Three or More Glasses/Day of Milk,* 2009 7.2% - 10.2% 10.3% - 13.0% 13.1% - 16.1% 16.2% - 24.1% No Data * During the 7 days before the survey. State Youth Risk Behavior Surveys, 2009
Percentage of High School Students Who Drank Three or More Glasses/Day of Milk,* 2009 Seattle Boston Milwaukee New York City Detroit Philadelphia Chicago San Francisco 6.6% - 8.4% Clark County 8.5% - 9.9% Memphis 10.0% - 11.7% Los Angeles San Bernardino Charlotte- Mecklenburg County 11.8% - 13.4% San Diego No Data Dallas Duval County Orange County Palm Beach County Broward County Miami-Dade County * During the 7 days before the survey. Local Youth Risk Behavior Surveys, 2009
Percentage of High School Students Who Drank a Can, Bottle, or Glass of Soda or Pop at Least One Time/Day,* by Sex† and Race/Ethnicity,‡ 2009 * Not including diet soda or diet pop, during the 7 days before the survey. † M > F ‡B > W, H National Youth Risk Behavior Survey, 2009
Percentage of High School Students Who Drank a Can, Bottle, or Glass of Soda or Pop at Least One Time/Day,* 2007 – 2009† * Not including diet soda or diet pop, during the 7 days before the survey. † Decreased 2007–2009, p < 0.05. National Youth Risk Behavior Surveys, 2007–2009
Range and Median Percentage of High School Students Who Drank a Can, Bottle, or Glass of Soda or Pop at Least One Time/Day,* Across 40 States and 19 Cities, 2009 * Not including diet soda or diet pop, during the 7 days before the survey. State and Local Youth Risk Behavior Surveys, 2009
Percentage of High School Students Who Drank a Can, Bottle, or Glass of Soda or Pop at Least One Time/Day,* 2009 14.5% - 22.4% 22.5% - 28.3% 28.4% - 32.6% 32.7% - 41.3% No Data * Not including diet soda or diet pop, during the 7 days before the survey. State Youth Risk Behavior Surveys, 2009
Percentage of High School Students Who Drank a Can, Bottle, or Glass of Soda or Pop at Least One Time/Day,* 2009 Seattle Boston Milwaukee New York City Detroit Philadelphia Chicago San Francisco 15.5% - 21.9% Clark County 22.0% - 27.7% Memphis 27.8% - 28.9% Los Angeles San Bernardino Charlotte- Mecklenburg County 29.0% - 39.2% San Diego No Data Dallas Duval County Orange County Palm Beach County Broward County Miami-Dade County * Not including diet soda or diet pop, during the 7 days before the survey. Local Youth Risk Behavior Surveys, 2009