Download
1 / 10
100 likes | 140 Views
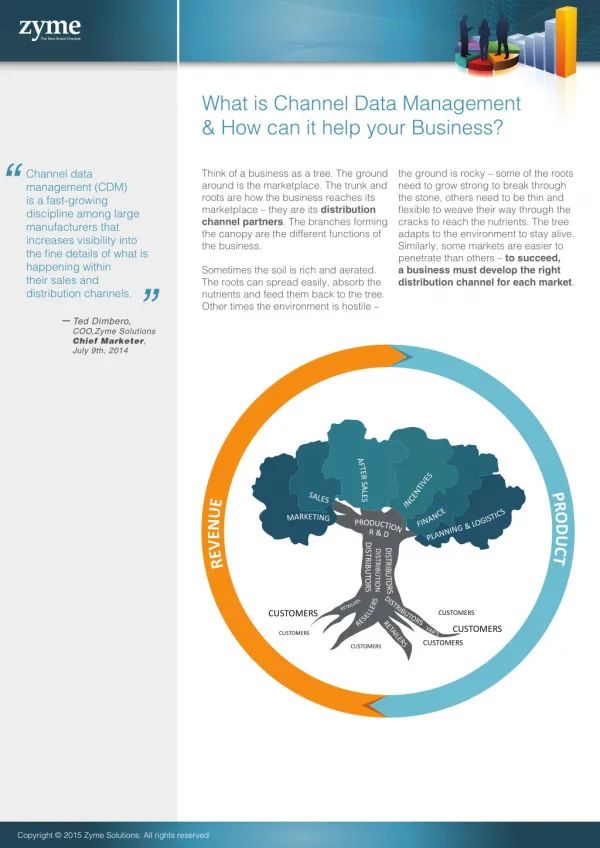
Zyme is the global leader in the emerging channel data management (CDM) space, empowering the <br>New Smart Channel™, To Know More:-http://www.zyme.com/

E N D
Channel Data Validations for Accurate Financial Reporting and SOX Compliance June 2010 About Zyme Zyme is the leading provider of channel data solutions for global technology companies. Zyme processes and validates millions of POS and inventory transactions each week from channel partners in 180 countries. Zyme supports customers with verified channel sales and inventory data for mission-critical business processes like revenue recognition, SOX compliance, incentive payments, sales commissioning, and supply chain planning. With its unique Service-On-Software offering, Zyme has earned an unparalleled reputation for value in the industry. Zyme provides seamless integration of channel data with CRM and ERP systems such as Salesforce.com, SAP and Oracle. As a recognition of its leadership, Zyme was announced a winner in the 2009 Informatica Innovation Awards, and was recognized as a 2010 Computerworld Honors Program Laureate. For more information call 1-877-262-8993 or visit www.zyme.com. This document contains proprietary information of Zyme Solutions, Inc., based on the experience and research of Zyme and its partners, and may not be reproduced without prior consent from Zyme Solutions, Inc. While every attempt has been made to ensure that the information in this document is accurate and complete, some typographical errors or technical inaccuracies may exist. The information contained in this document is subject to change without notice. Zyme does not accept responsibility for any kind of loss resulting from the use of information contained in this document. Further, Zyme is not, by means of this document, rendering business, financial, investment, or other professional accounting advice or services. Before making any decision or taking any action that may affect your business, you should consult a qualified professional advisor.
Table of Contents 1 Executive Summary ...................................................................................... 3 2 How Channel Data is Used in Financial Reporting ...................................... 3 2.1 Revenue Reporting ...........................................................................................................3 2.2 Reporting of Deferred Revenues for the Balance Sheet ..................................................4 2.3 Estimates for Accounting Allowances ..............................................................................4 2.3.1 Estimating price protection reserves .....................................................................4 2.3.2 Estimating the Returns Allowance .........................................................................5 3 Validations and Analyses for Channel Parter Data ....................................... 6 3.1 SISO Reconciliation ..........................................................................................................7 3.2 Inventory Aging .................................................................................................................9 3.2.1 Using the inventory aging report for financial reporting ........................................9 3.2.2 Trend Analysis—Weeks of Inventory on Hand .......................................................9 3.2.3 Using a trend analysis for financial reporting ........................................................9 3.3 Sell-in Trend and Timing Analysis .....................................................................................9 4 Conclusion ...................................................................................................10 2 Channel Data ValiDations for aCCurate finanCial reporting anD soX ComplianCe|
1 The channel now accounts for 66% of overall technology sales, according to an Accenture analysis based on Gartner data1. Because so much revenue flows through channels, and because Sarbanes-Oxley (SOX) has increased the industry’s scrutiny of financial data, obtaining reliable channel partner data has become a critical component of creating accurate financial statements. At the same time, unreliable data is a potential SOX control weakness. Technology vendors use channel partner data to: Executive Summary • • • Calculate revenue sold through indirect channels Generate analyses that validate their revenue recognition decisions and accounting estimates Better manage the indirect channel by assessing current data against historical trends and ratios Determine sales compensation Calculate partner incentives to be paid • • This paper discusses the role of channel partner data in financial reporting. It outlines several data validation and analysis methods that vendors can use to ensure the reliability, accuracy, and auditability of their financial statements and improve channel management. 2 How Channel Data Is Used in Financial Reporting 2.1 Revenue Reporting For financial reporting purposes, the reliability and accuracy of partner-reported sales and inventory data is important, whether a company recognizes revenue on a sell-through, sell-in, or hybrid basis. For companies with a sell-through revenue recognition policy, in which revenue is recognized only when product ships from distributors to resellers or end customers, anywhere from 40% to 100% of a company’s reported revenue may be based on partner-reported sales and inventory data. Companies with a sell-in revenue recognition policy recognize revenue immediately when product ships to the channel. However, future product returns, rebates, warranty claims, and special pricing adjustments must be estimated based on historical data. Through contra- revenue accounts, these estimates are then commonly applied as reductions to recognized revenue on the income statement. These estimates are a prime target for scrutiny by auditors. Partner-reported inventory data provides the required audit trail to support the adequacy of the various allowances and reserves for special pricing, returns, warranty, and incentives. In calculating revenue to be recognized, companies must assign prices to units sold through the channel. This can be a complicated task for companies that use the sell-through approach for any portion of their indirect sales. This task can be accomplished through a number of methods: • On a first-in, first-out (FIFO) basis, which assumes that the units sold into the channel first were also sold out of the channel first. To account for price protection or other special pricing situations, the applicable price for revenue recognition purposes is the price listed on the date of sell-through. Exceptions must be made when the listed price is greater than the sell in invoice price, when the sold-through goods are no longer eligible for recent price protections, etc. Because of the complexity of the rules for pricing transac- tions, it is especially critical for audit purposes for companies to have a reliable, consis- tent process, as well as “clean” and accurate channel data to work with. On a serial number basis, in which the serial numbers of point of sale (POS) units or the units remaining in inventory are tied to their respective sell-in invoices, thereby using the exact sell-in price of the unit for accounting. • 3 Channel Data ValiDations for aCCurate finanCial reporting anD soX ComplianCe|
• • On the basis of an assigned value based on price books. On the basis of an assigned value based on a calculated average partner sell-in price. As the flip side of the revenue calculation, the FIFO or serial-number methods are also applied to channel inventory to generate an inventory aging report, which details the number of units held in inventory for given time frames and the current value of those units. The inventory aging report can be used to adjust allowances for returns and warranty claims, as well as to evaluate the overall health of the channel. 2.2 To recognize revenue for some portion of their indirect sales, many companies create a “deferred revenues” entry on the balance sheet for units that have been sold into the channel but have not yet been sold through. This is calculated by subtracting total partner-reported sell-through from total sell-in. For products with relatively stable prices, the price per unit is determined using an average selling price (ASP). For products with more volatile pricing, the price can be established by associating the partner-reported unsold inventory to the sell-in invoices on a FIFO basis, using adjustments for recent pricing actions. Reporting of Deferred Revenues for the Balance Sheet 2.3 As discussed above, it is common to use channel partner POS and inventory data to estimate the reserves required for revenue adjustments due to price protection, tier 2 incentives, warranty claims, returns, and inventory obsolescence. Below are some examples of this process. Estimates for Accounting Allowances 2.3.1 Estimating price protection reserves Many high-tech companies use price protection to ensure an adequate level of distributor inventory in the channel. However, by definition, price protection means that the sale price is not final at the time of sell-in. Thus, making accurate projections of price protection liability and allowing for this liability becomes important. In general, companies govern price protection through a number of rules. For example, it is typical for only recent inventory (e.g., inventory procured within the last two months) to be price protected. To estimate the price protection allowance, companies generally look at past sell- through rates to determine the quantity of goods that would be in the channel within a specified period of time after sell-in. A more accurate method is the FIFO method. FIFO is based on actual data, while looking at past sell-through rates provides a more general estimate. Reports such as the example report below would help the company’s finance manager assess the adequacy of allowances made. This report shows, by SKU and distributor, the estimated value of price protection claims, corresponding to inventory of various ages, that result from a 10% decrease in price. Vendors can look at the liability by inventory age and adjust the timing of their price changes in order to minimize price protection claims. Liability Resulting from a 10% Decrease in Price (by Inventory Age) More than 12 Weeks Partner SKU 1 Week or less 1 to Weeks 2 to 4 Weeks 4 to 8 Weeks 8 to 12 Weeks Total SKU-A $100 $200 $100 $100 $0 $0 $500 SKU-B $0 $0 $0 $500 $400 $500 $1,400 Distributor A SKU-C $23 $0 $10 $0 $0 $0 $33 Sub total $123 $200 $110 $600 $400 $500 $1,933 SKU-A $0 $100 $20 $100 $0 $0 $220 SKU-B $0 $0 $0 $0 $600 $0 $600 Distributor B SKU-C $50 $30 $10 $0 $0 $0 $90 Sub total $50 $130 $30 $100 $600 $0 $910 Total $175 $330 $140 $700 $1,100 $500 $2,843 Figure 1: Report of Liability for Price Protection Claims; by SKU, Distributor, and Age of Inventory Units 4 Channel Data ValiDations for aCCurate finanCial reporting anD soX ComplianCe|
2.3.2 Estimating the Returns Allowance Most companies provide an allowance for future returns. Typically, this allowance is estimated based on the quantity of return material authorizations (RMAs) received historically in proportion to sales. However, additional checks are necessary under some circumstances, such as the launch of a new product with no comparable history, changes in the overall business environment, or the high variability of past return rates. Greater-than-average return rates can be discovered by comparing the number of recent POS returns and RMAs with the historical average. If the POS return rate has been steadily increasing or decreasing in recent months, the current return allowance might have to be revised. A report like the one shown in the example below, which compares the POS returns to sell-through during various periods over the prior year, would help the finance manager determine the adequacy of the return reserves. In this example, return reserves are currently set at 3.5% of sell through. SKU’s with return rates between 3.5% and 3.99% are flagged in light gray, while those over 4% are flagged in dark gray. Managers can easily identify return rates that exceed current allowances over a period of time and adjust the allowances accordingly. Using the graph, managers can spot trends over time by distributor and use the information to better manage their channel partners. Similar reports could also be prepared based on RMA and sell-in data. 1- 1- 3- 3- 6- 12- 6- 1- 12- 3- 12- 6- Month POS Return Month POS Return Month Sell through Month Sell Through Month Sell- Through Month POS Return Month Sell- Through Month POS Return Month Return Rate Month Return Rate Month Return Rate Month Return Rate Partner SKU SKU-A 3.00% 3.4% 3.10% 3.20% $57,828 $1,735 $29,212 $993 $15,005 $465 $4,567 $146 SKU-B 3.60% 4.00% 4.80% 5.60% $65,122 $2,344 $29,034 $1,161 $11,892 $571 $3,412 $191 Dist A SKU-C 2.9% 2.8% 3.20% 3.00% $97,612 $2,831 $53,312 $1,493 $27,098 $867 $10,966 $329 Sub total 3.13% 3.27% 3.52% 3.52% $220,562 $6,910 $111,558 $3,647 $53,995 $1,903 $18,945 $666 SKU-A 3.20% 2.90% 3.10% 3.10% $23,123 $740 $11,560 $335 $5,991 $186 $1,808 $56 SKU-B 3.45% 3.98% 4.40% 5.10% $62,422 $2,154 $31,211 $1,242 $13,122 $577 $4,800 $245 Dist B SKU-C 2.88% 2.88% 3.00% 2.87% $10,999 $317 $5,989 $172 $3,400 $102 $900 $26 Sub total 3.33% 3.59% 3.84% 4.35% $96,544 $3,210 $48,760 $1,750 $22,513 $7,508 $327 $865 Total 3.19% 3.37% 3.62% 3.75% $317,106 $10,120 $160,318 $5,397 $76,508 $2,768 $26,453 $ 993 Figure 2: Returns as a Percent of Sell-Through (Rates Exceeding Currently Established Reserve Levels are Flagged) Figure 3: Overall Return Rate and Return Rate by Distributor for Given Time Periods 5 Channel Data ValiDations for aCCurate finanCial reporting anD soX ComplianCe|
When, for a period of several weeks, there are high levels of inventory for a product whose sales are generally slowing, this serves as another leading indicator that higher- than-normal returns can be expected. The example report below highlights a case where abnormally high inventory is present for products that are not selling well (i.e., aged inventory). This report, in conjunction with the one that analyzes return rates, would help the decision-maker zero in on cases where the return allowances might need to be adjusted from normal levels. Such reports could prove useful in cases such as a new product launch where its market acceptance is different from that of similar products. For example, there are currently 14 weeks of inventory of SKU-B at Distributor A, and 64% of that inventory is older than 8 weeks. Distributor B is also reporting a buildup of SKU-B. inventory over 8 weeks. This is a flag to look more closely at the return reserves for SKU-B. Inventory Older Than 8 Weeks Total Unsold Inventory ($) Total Unsold Inventory (Units) 1 Over 12 Weeks Weeks of Inventory Week or Less 1 to 2 Weeks 2 to 4 Weeks 4 to 8 Weeks 8 to 12 Weeks Partner SKU SKU-A $1,000 $2,000 $1,000 $1,000 $0 $0 125 $5,000 0% 5 SKU-B $0 $0 $0 $5,000 $4,000 $5,000 700 $14,000 64% 14 Dist A SKU-C $225 $0 $100 $0 $0 $0 13 $325 0% 0.7 Sub total $1,225 $2,000 $1,100 $6,000 $4,000 $5,000 838 $19,325 47% 7.7 SKU-A $0 $1,000 $200 $1,000 $0 $0 55 $2,200 0% 5 SKU-B $0 $0 $0 $0 $6,000 $0 300 $6,000 100% 5 Dist B SKU-C $500 $300 $100 $0 $0 $0 36 $900 0% 4 Sub total $500 $1,300 $300 $1,000 $6,000 $0 391 66% 4.9 $9,100 Total $1,725 $3,300 $1,400 $7,000 $10,000 $5,000 1,229 $28,425 53% 6.5 Figure 4: Inventory Aging Report, by Distributor and SKU Figure 5: Graph of Inventory Balances, by Partner and Age of Inventory 3 Validations and Analyses for Channel Partner Data Accurate channel partner data is a critical input for reliable financial statements. However, most companies have little ability to assess the data from their partners—they must accept it on the “honor system.” To ensure that the data is complete and accurate enough to be used for financial reporting, there are several levels of validation and analysis that are considered best practices. 6 Channel Data ValiDations for aCCurate finanCial reporting anD soX ComplianCe|
Sales in, sales out (SISO) reconciliation is a good first step to take in establishing the reliability and accuracy of the data used in financial statements. Additional analyses serve to highlight and resolve such business issues, as well as to improve the accuracy of certain accounting allowances. For example, to determine whether reported channel partner inventory levels are reasonable and accurate, finance personnel can analyze the trend of weeks of inventory on hand to see whether it is increasing. If the inventory is increasing, finance personnel might use an inventory aging report to compare its data against trends in the SISO ratio and observe historical seasonality. Over an extended period of time, sales into the channel and sales out should match closely; however, inventory may increase seasonally, as it does prior to the U.S. holiday season. A report that shows the ratio of sell-in to sell-out over a rolling period of between 4 and 8 weeks can highlight cases where sell-in and sell-out are not aligned. The aging report can provide important insights about whether the inventory is aged or has built up recently, in order to support expected future spikes in demand. A more detailed discussion of some useful channel management analysis tools follows. 3.1 The SISO reconciliation approach can serve as an internal SOX control (Section 404) that can give a manufacturer confidence in distributor-reported data. In this method, the sell-through and inventory data provided by the channel partner is compared to the sell-in data to see whether variances between them fall within reasonable limits that could be explained by causes such as transit time. The method relies on making an estimate of the inventory (i.e., calculated inventory) based on the previous week’s calculated inventory, SISO data, etc. The calculated inventory for SISO reconciliation is computed as follows: SISO Reconciliation Calculated inventory = Previous week’s calculated inventory + Sell-in + Transfers from other partners – Transfers to other partners – Sell-through + Returns to partner – RMAs (returns to the company) – Adjustments (scrap, theft, etc.) The difference between calculated inventory and partner-reported inventory is the variance, or delta. The sign of the delta can be positive or negative—variance in either direction is equally relevant—so the absolute value of the delta for each SKU and channel partner is considered. Variances are expressed as a fraction of the partner-reported inventory. An acceptable variance depends on a number of factors, including product type, volume of sales for the product, and region. The primary output of SISO reconciliation is a report, such as the one below, that gives a quick snapshot of which partners have reliable data and which do not. The first four partners on the list have a delta equaling or exceeding a predefined limit of 20%, while the next three are approaching the limit. 7 Channel Data ValiDations for aCCurate finanCial reporting anD soX ComplianCe|
End Abs % Delta ($) MR Net Delta (Units) Abs Delta ($) Shipments ($) Abs Delta (Units) Net Delta ($) Calc Inv ($) Rpt Inv ($) Partner Arlow USA 1,522,452 6,103,880 (1,499,362) (5,978,770) - 3,335,233 1,499,362 - Gomee 1,142,993 1,199,583 (1,027,411) (283,002) 2,857,109 64,954,341 3,884,520 40% Kago Electronics 3,557,869 4,771,169 (242,524) (1,281,372) 14,792,307 201,477,790 15,034,832 24% Ingra USA 1,363,817 2,057,873 325,817 447,771 6,794,734 181,578,399 6,468,917 20% Digita China 726,254 1,255,981 (425,525) (722,703) 3,813,553 73,188,378 4,239,077 19% Futuro Europe 1,292,027 4,487,947 (1,208,770) (4,329,908) 7,274,943 88,769,815 8,483,713 18% BCI Camera 299,229 1,046,747 (144,499) (782,838) 1,875,064 31,137,020 2,019,564 16% Intcomix 1,046,137 3,560,762 568,138 1,842,213 7,302,110 76,808,770 6,733,972 14% Soga Computers 5,363,695 22,508,005 (722,785) 5,230,947 46,284,456 497,356,692 47,007,240 12% Futuro AsiaPac 1,004,887 7,310,095 989,740 7,106,040 8,910,507 69,179,734 7,920,767 11% Alabella 612,285 1,670,309 (420,119) (1,084,744) 6,531,493 94,721,739 6,951,613 9% Officeworkers 5,379,998 22,927,356 1,930,000 3,646,953 60,758,752 789,228,521 58,828,752 9% Ingra Canada 1,463,143 5,212,184 204,483 (129,185) 17,979,541 207,628,324 17,775,057 8% Havnet Europe 690,694 2,582,110 (502,731) (1,987,277) 10,736,050 172,847,900 11,238,781 6% Best Buyers USA 1,057,344 5,564,791 (880,108) (5,324,152) 18,349,209 134,595,238 19,229,318 6% Total 30,790,751 105,843,998 (2,516,631) 425,816 253,164,030 3,021,900,338 255,680,661 12% Figure 6: SISO Reconciliation Report Highlighting Partners with an Unacceptable Delta Between Reported and Calculated Inventory The trend of the deltas is also of interest. If the calculated inventory diverges continuously (i.e., week after week in either direction) from the reported inventory, this is a cause for concern and should be investigated. The calculated and reported inventories are not expected to match in most weeks, but a close convergence between the two is expected. SISO reconciliation can highlight several types of issues: • • Inaccurate POS and inventory data Errors or inadequacies in the internal process for aggregating and validating channel partner data Operational issues, such as the failure to capture data from certain SKUs or warehouses Underlying market dynamics, such as a buildup of channel inventory due to changing demand patterns • • Once an issue has been flagged due to a SISO reconciliation variance, additional validations can be performed to identify the root cause of the variance and make adjustments by: • Working with channel partners to improve the quality and timeliness of their data through partner reporting requirements and compliance scorecards Identifying and resolving errors in the aggregation and validation of data Resolving basic operational issues, such as the failure to capture data from certain ware- houses or SKUs Identifying inventory buildups or shortages, inaccurate claims payments, etc. • • • 8 Channel Data ValiDations for aCCurate finanCial reporting anD soX ComplianCe|
3.2 Inventory Aging A report on the age of inventory held by the partner can be used as a tool to improve overall channel management—for example, aging inventory can highlight unintentional channel stuffing. Two common methods for assessing inventory aging include: • FIFO method. In this method, the age of the inventory is estimated by assuming that the goods that were sold into the channel first were also sold through the channel first. Partner-reported inventory units are therefore assigned to the latest sell-in invoices, and the dates of these invoices provide an estimate of the age of the inventory. It’s also pos- sible to calculate an average inventory age weighted by value. Serial number method. This method is more accurate, but it requires partners to provide serial numbers for each individual unit in inventory. The serial numbers can be tied back to the sell-in data for each unit, and the age of each unit can be estimated based on the date it was shipped from the company. • 3.2.1 Using the inventory aging report for financial reporting In addition to its use as a channel management tool, the inventory aging report is required for: Estimating reserves for inventory obsolescence—as inventory ages, it is more likely to • become obsolete Estimating price protection reserves—only inventory that is older than a given threshold • (e.g., older than two months) is eligible for price protection Assessing the adequacy of warranty/return reserves in special circumstances, such as: • o New products that are not comparable to those for which historical return data exists o Changes in the overall business environment o Large variations in return rates in the past In these cases, observing very high weeks of inventory of a product whose sales are slowing down overall indicates that higher-than-normal returns could be expected. 3.2.2 Trend Analysis—Weeks of Inventory on Hand Weeks of inventory on hand is calculated by dividing on-hand inventory by a four-week average of weekly sales. Typically, this metric is used in conjunction with the inventory aging report. For channel management purposes, an increase in the weeks of inventory on hand may highlight issues such as slowing demand or channel stuffing. 3.2.3 Using a trend analysis for financial reporting As a quick method of assessing excess inventory in the channel, the weeks of inventory on hand metric is often used to help make the appropriate adjustments to various allowances. When the value of this metric is very high, it could indicate additional liability for any upcoming pricing action (due to price protection), and if the value is high primarily due to aged inventory, this could indicate a higher possibility of returns. 3.3 In the absence of upcoming product promotions, sudden spikes in the quantity of sell- in inventory could be a cause for concern. An analysis of the weekly sell-in quantity in conjunction with the weeks of inventory on hand could highlight instances of unnecessary sales into the channel. Sell-in Trend and Timing Analysis In general, over an extended period of time, the sell-in and sell-out quantities should match closely. A report showing the ratio of sell-in to sell-out over a rolling period between 4 and 13 weeks would help highlight cases where the sell-in is not aligned to the sell-out. 9 Channel Data ValiDations for aCCurate finanCial reporting anD soX ComplianCe|
4 Conclusion Inaccurate channel partner data or an inadequate process for consolidating and reconciling channel partner data can lead to material financial statement issues, such as: Inaccurate revenue reporting • Inaccurate balance sheet numbers (deferred revenues) • Inaccurate accounting estimates or an inadequate audit trail for accounting estimates, • such as: o Reserves for returns and warranty claims o Reserves for rebates, price protection, and other special pricing programs o Allowances for inventory obsolescence These problems arise in part due to the nature of the financial reporting process. Instead of setting specific, detailed rules for internal controls around the financial reporting process, SOX-compliant financial reporting requires accounting and finance departments to make many judgment calls, guided by the high-level principles set forth by the Public Company Accounting Oversight Board (PCAOB) and the SEC. With the onus on companies to provide adequate supporting information for their financial reporting decisions and to demonstrate that they have proper controls over financial data in place, obtaining timely and accurate POS and inventory data from channel partners becomes a critical step in the financial reporting process. By focusing on validations and analysis of this data, companies can improve the reliability, accuracy, and auditability of their financial statements and can better manage their indirect channel. 1“Developing Indirect Channels: A Structured Approach to Reaching New Customers and Growing Revenues.” Accenture, May 27, 2009. 10 Channel Data ValiDations for aCCurate finanCial reporting anD soX ComplianCe|