Bringing Assessment Data Into the Classroom SSDA Annual Conference - 02/20/2018
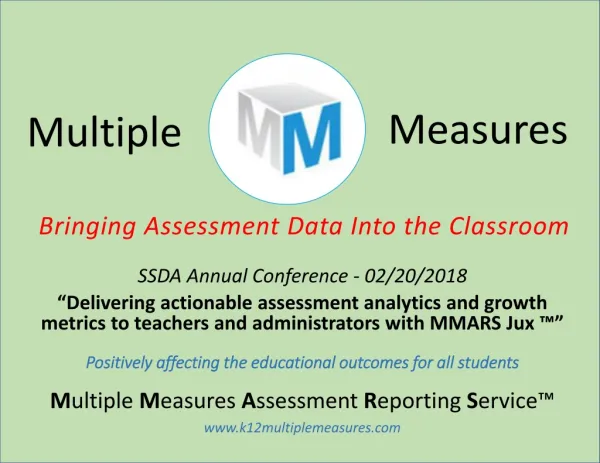
Measures. Multiple. Bringing Assessment Data Into the Classroom SSDA Annual Conference - 02/20/2018 “Delivering actionable assessment analytics and growth metrics to teachers and administrators with MMARS Jux ™” Positively affecting the educational outcomes for all students.

Bringing Assessment Data Into the Classroom SSDA Annual Conference - 02/20/2018
E N D
Presentation Transcript
Measures Multiple • Bringing Assessment Data Into the Classroom • SSDA Annual Conference - 02/20/2018 • “Delivering actionable assessment analytics and growth metrics to teachers and administrators with MMARS Jux ™” • Positively affecting the educational outcomes for all students • Multiple Measures Assessment Reporting Service™ • www.k12multiplemeasures.com
What do we do? • Assessment reporting servicesServe K-12 school districts and charter schools throughout the U.S. We are not an assessment company. • Analytics / graphics / visualization / comparisons Provide a variety of multi-year achievement and growth reports for pupils, groups, and subgroups. • Assessment data warehouse.Report ANY annual or periodic assessment.
Supported Tests and more … • State tests/ high stakes ELA & Math assessments (SBAC, PARCC, independent) for any state. We currently serve LEAs in California, Utah, New Jersey, Michigan, and are working with pilot sites in Illinois, Colorado, Minnesota, Ohio, Oregon, and Washington. More to come. • Other state tests (EL, SWD, Science, Social Studies, etc). • Interim / benchmark / diagnostic tests from major publishers (iReady, NWEA-MAP, Study Island, Renaissance, PSAT, Illuminate, etc.) • District-built tests, including course classroom grades. • We have the ability to set up any annual or periodic test, even if not currently supported.
What sets us apart? • Batch Processing: Automated, iterative reports for each school and/or each teacher. With one instruction (inside of 30 seconds), we (or you) can create hundreds, or even thousands, of reports, automatically. Incredibly efficient, especially for larger districts, and at the teacher/classroom level. • Pre-built Library / Report Inbox: Those thousands of reports referred to above? … we will pre-build them for you. Or, you can create-your-own. We offer easy, secure, electronic distribution to all your stakeholders, in all levels/roles: district evaluators, site administrators, teachers. • Ease of use: Zero to Minimal training required. Low staff time. We do all the work. more …
MMARS ™ only features … continued • Speed / performance: Our reports, even summaries with large student counts, are displayed in seconds. No need to wait and/or come back later to confirm completion, then download. No need to initiate each report separately. • Output: In addition to attractive on-screen display, we offer all reports in print-friendly PDF format, and we offer the underlying pupil or aggregate data via Excel. more …
MMARS ™ only features … continued • Jux™ summaries(short for juxtaposition …. graphical side-by-side comparative reporting). Compare years, terms, subjects, claims/clusters, schools, grades, and teachers. • Matched-student pre-post growth reportingat pupil and aggregate levels, with our FPL™ and PD3™ change metrics. • Classroom pupil lists, using your rosters (as-tested and new school year; even period-by-period for secondary schools). • Classroom summaries, comparative teacher reports –quantifying Instructional Impact. more …
Turnaround Time How long will it take us to have reports in your hands? • Currently supported tests: 3 business days (or faster) • New tests: approx. 2-4 weeks
Online Access / Student Privacy / Customer Support • Online access is role-based and secure (district evaluators, site administrators, teachers). • Each user can see only the students and/or summaries that pertain to their role. • SSL encryption. Data transfer via ShareFile (built by industry-leader Citrix). MMARS™ reporting site also SSL. • Compliant with all legislation, including FERPA, COPPA, PPRA, SOPIPA, or your unique data privacy agreement. We are a subscriber, offering electronic endorsement for the CSDPA – California Student Data Privacy Agreement. • Live telephone, email, chat, and remote online assistance, during the business day.
Additional Information / References • We offer a MMARS™ Free Edition. This provides a wealth of districtwide and schoolwide summary and comparison graphic reports. No risk, no cost, your data. Visit our store to order. • Please visit our website for more information and LOTS of report examples. • Call, email, or live chat with us for additional information, or to schedule a demo / presentation. www.k12multiplemeasures.com 530-295-1262 tech@multiplemeasures.net
CHECK OUT OURWEBSITE • Website introduction • www.k12multiplemeasures.com • Reports Gallery • Information & Examples • MMARS™ Free Edition
Pre-built Report LibraryEvery administrator & teacher has their own searchable Inbox • We do all the work. As soon as we load your data, we build a library for you, containing a plethora of summary and pupil reports. • Then, on your timetable, we reveal these reports to authorized administrators and teachers, according to their role. Each user has their own Report Inbox. • No training is required. All a user needs to know is how to use a search toolbar … and we provide tips and keywords for accessing specific assessment related information. We also offer an alternative, organized Report Browser with a tree/hierarchy structure to easily locate your reports. • View the PDF or Excel reports with a click. • Use familiar tools to Share, Download, Notify, Email, Move, Copy, Delete.
Our InCRedible automation • Batch (auto-iterative) reporting • Report Library(all the pre-built reports) • ReportInbox(each user’s unique view to the Library)
Use the tool icons to perform actions. • Refresh • Download • Delete • Notify • Email • Share • Favorite
Search with keywords to find precisely the reports you’re seeking.
Browse through the variety of different summary and pupil reports.
Reports are organized clearly by test, content, and reporting groups.
On any report link, you can “hover” your mouse to view the full set of report details. Or, simply click the link to view the printer-friendly report.
Achievement & Change Scores ALD PL SS NPR RIT Prof %Cor RS SIP GLE Lexile RR NCE S9 PredSS PredPL SGP … and more Achievement Level Descriptor Performance Level Scale Score National Percentile Rank Rasch UnIT Proficiency Percent Correct Raw Score (number correct) Standard Item Pool Grade Level Estimate Lexile Reading Rate Normal Curve Equivalent Stanine Predicted Scale Score Predicted Performance Level Student Growth Percentile • We report a variety of scores on pupil and aggregate reports.The scores presented depend on your test(s). • We also compute year-over-year and term-to-term change for these scores.
Our Unique Growth Measures • FPL™ – Fractional Performance Level™ (and ∆FPL™) PD3™ – Pupil Distance from Level 3™ (and ∆PD3™) • For each student, for each span of years and/or terms, we compute the change in performance/achievement. We compute this change for the most recent, and all prior spans. • FPL™: We compute “between” the bands. A student’s Performance Level no longer needs to be represented as a broad figure between 1-4. We provide the Performance Level, on a continuum, based on the scale scores, to the hundredth of a level. • PD3™: We compare each scale score vs. the minimum score required to be proficient, and compute the difference. This is the foundation of the CA School Dashboard, but available for other tests, as well. • Ranked student lists show who improved/declined the most.Jux™ side-by-side summaries show which groups improved/declined the most. • For annual tests taken in the spring, the summaries compare the Instructional Impact, for schools, grade-levels, subgroups, and teachers.
FPL™ Student Growth Scores in MMARS™ • Fractional Performance Level™ For each student and subject, the achieved Scale Scores are interpolated between the highest and lowest obtainable scale scores (HOSS/LOSS), in their performance level band, for their grade level. • The relative position in the band is computed in hundredths. • For example, an FPL™ score of 2.68 means the student is Level 2 (nearly met) and 68% of the way to Level 3.
Fractional Performance Level™ Pupil Distance from Level 3 Computation of a student’s CHANGE scores in MMARS™
SBAC Fractional Performance LevelT (FPLT) Year-over-Year Change in FPLT (ΔFPLT)
Pupil Achievement with Growth Scores (∆FPL™, ∆PD3) - Multi Year Classroom List
Pupil Change in Fractional Performance Level™ - Single Year Ranked Classroom List
Pupil Change in Distance from Level 3 – Multi Year Classroom List
Measures Multiple www.k12multiplemeasures.com 530-295-1262 tech@multiplemeasures.net