Download
1 / 25
270 likes | 705 Views
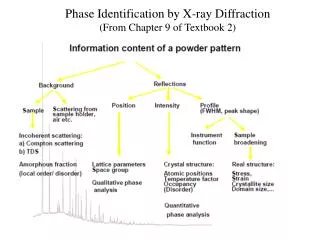
Phase identification by combining local composition from EDX with information from diffraction database. János L. Lábár. Introduction to EDX analysis Usage of the XRD database. Composition by EDX. Ionization by fast electrons in the TEM Alternative ways of de-excitation

E N D
Phase identification by combining local composition from EDX with information from diffraction database János L. Lábár • Introduction to EDX analysis • Usage of the XRD database
Composition by EDX • Ionization by fast electrons in the TEM • Alternative ways of de-excitation • Photons leaving the sample • Detection / detectors • Qualitative vs. quantitative analysis • Precision, accuracy, detection limits, spatial resolution • Artifacts and their elimination • Effect of crystal structure: ALCHEMI
Excitation and de-excitation • Primary process: ionization EELS • Competing secondary processes: XR / AE • Single-electron process: X-ray photon emission • Two-electron process: Auger electron emission • Connection: fluorescence yield =NX/(NX+NA)
Fluorescence yield First problem with light element detection
Cascading of X-ray lines • Naming convention • Quantitative analysis uses one analytical line weight of lines is needed
Self-absorption in the sample • Absorption path length vs. thickness, ideal geometry Lt*cosec() • Thin-film approximation No thickness is needed • Methods to determine thickness (EELS, CBED, …) • Accuracy problems with light elements, irregular samples
Detection in EDS • , Fano factor • Escape peak • Dead-layer • Detector thickness
From detector to X-ray analyzer • Detector + preamplifier • Main amplifier, MCA, pile-up rejection • Spectral resolution, • Si Ge FWHM2 =N + FE • Temperature
From detector to X-ray analyzer • Temperature Window • Detection of light elements
Artifacts: ice Can be identified and removed
Quantitative analysis Cliff-Lorimer: thin film appr. cA/cB=kAB*(IA/IB) • kAB is dependent on the detector • Significant differences in „sensitivity” • Standards vs. standardless
Quantitative analysis: standardless • Intensity: • For high energy electrons: NQ(E0) • Atomic data, Detector parameters • Sample thickness: absorption • Secondary fluorescence • Artifacts: escape, contamination, spectral, channelling
Thin sample criterion • Different condition for EDS and imaging • Thickness not needed for many samples • Depends on detector position for EDS • Depends on combination of elements • Determination of thickness: CBED, …
Artifacts: spectral contamination • Stray radiation from thick parts • Can be identified • Frequently can be corrected for
Structure from „artifact”: ALCHEMI • Bloch-waves in crystals • Orientation-dependent excitation • Inhomogeneous within unit cell syst. error • Main components at known sites = inner standards • Location of minority c. (additional information)
ALCHEMI example: garnet • Calculations predicted distinct variation of all three crystallographic sites (in a rest. range) • Experiment proved it for main components • Location of minority Ca and Mn is unambiguously determined
Summary: EDS analysis in the TEM • Multi-elemental, parallel • 5 Z (with ATW) • Elemental compositions (not sensitive to the chemical state) • Detection limit 0.1 wt% • Accuracy 2-10% (standardless vs. standards, stray radiation) • Spatial resolution: 1 nm (FEG), 10 nm (LaB6), (sample thickness)
The XRD powder database • Evolution of the ICDD database • JCPDS cards • Pdf-2 database • Pdf-4 relational database, time-lock, atomic p. • Usage of the database • ICDD software • Manufacturer’s software • Other programs (ProcessDiffraction)
The JCPDS cards in the Pdf-2 database As shown by the PCPDFWIN program Name & reference Space group, cell parameters d-spacing, Intensity, Miller-indices Radiation, wavelength, filter
Searching for known structures in the XRD database ICDDsoftwares • PcPdfWin • PcsiWin
Searching for known structures in the XRD database: ProcessDiffraction Filtering for elements Filtering for d-values
Why XRD database can only be used for qualitative phase analysis in electron diffraction? • X-rays are scattered on the electrons of the sample • Fast electrons of the TEM are scattered on total charge (electrons + nuclei) • Intensities of the diffracted lines are different • Quantitative phase analysis needs a calculation of intensities from a structural modeland nanocrystalline samples
Conclusion • Unambiguous phase identification needs both compositional and structural information. • Composition from EDS (or EELS) • XRD database is a useful collection of known structures easiest first source of information during assessment of SAED patterns • Quantitative phase analysis needs a calculation of intensities from a structural model