Download

1 / 31
310 likes | 344 Views
Explore NMR and acoustic signatures in vuggy carbonate aquifers using digital processing techniques. Understand pore system characteristics, NMR well log calibration, and permeability estimations through various measurements and analyses.

E N D
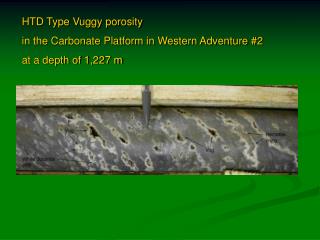
NMR AND ACOUSTIC SIGNATURES IN VUGGY CARBONATE AQUIFERS Southwest Research Institute J.O. Parra, C.L. Hackert, Southwest Research Institute; H.A. Collier, Collier Consulting; M. Bennett, South Florida Water Management District
Summary Digital processing of optical macroscopic (OM), scanning electron microscope (SEM), and X-ray computed tomography (CT) images, as well as petrography, are used to characterize the pore space of the pore system of vuggy carbonate aquifers in South Florida. The results of this analysis provide information with which to evaluate nuclear magnetic resonance (NMR) well log signatures for NMR well log calibration. Saturated and desaturated NMR core measurements aid in estimates of the irreducible water in the rock and the variable T2 cut-offs for the NMR well log calibration. The measurements establish empirical equations to extract permeability from NMR well logs. Analyses of synthetic and observed NMR signatures demonstrate that NMR well logs capture the micro and macroporosities of the carbonate rock. The CT image processing and the ultrasonic analysis provide information that helps characterize the acoustic signatures caused by interconnected and connected vugs in core samples. The ultrasonic core and geotechnical data provide velocity versus porosity relationships based on flow zone indicators. These relationships are input into a poroelastic modeling program to determine the squirt-flow lengths associated with the fluid flow between the matrix and the vugs, and between the vugs. Based on this information, attenuation and velocity dispersion curves of the vuggy carbonate rock are simulated in the frequency range of sonic logs and high resolution interwell seismic, which in turn relates velocity from sonic logs to NMR-derived permeability and porosity. The resulting equations are applied to predict permeability and porosity images from velocity tomography data recorded between two wells in a carbonate aquifer in western Hillsboro County, Palm Beach, Florida.
Figure 1. A 3D view of an X-ray CT scan image of the diameter of core 41, showing an interconnected vug system typical in carbonate rock from the Ocala Limestone Formation, Palm Beach, South Florida. This core is from a limestone with wackestone texture taken from a depth of 1138 feet in the Ocala, an Upper Eocene formation. The high permeability of the sample is controlled by interconnected vugs, and a stochastic analysis of the CT image predicts two length scales: 2.2 and 17 mm in the z-direction, and 2.4 and 7.2 mm in the xy-plane.
Figure 2(a). (a) Calculated density from the X-ray CT data for a slice from core 41. Data plotted is dry density in g/cc.
Figure 2(b). (b) A photograph of the end of core 41. This core has extensive cavities that are captured by the CT images.
Figure 3(a). (a) 2D density images of cores 7 and 41 show small separated and large interconnected vugs, respectively. Permeability of core 7, also from the Ocala Formation, is 7 millidarcies; permeability of core 41 is > 4000 millidarcies.
Figure 3(b). In (b) and (c), the black line is the waveform for a homogeneous saturated core, the green line is the waveform for a heterogeneous saturated core, and the red line is the waveform for a heterogeneous dry core. (b) The synthetic waveform for core 7 is almost identical to the waveform of a uniform, equivalent core, although reduced in amplitude. Core 7 has few cavities and is much more uniform than core 41.
Figure 3(c). In (b) and (c), the black line is the waveform for a homogeneous saturated core, the green line is the waveform for a heterogeneous saturated core, and the red line is the waveform for a heterogeneous dry core.(c) The waveforms associated with core 41 reflect the heterogeneity of the carbonate sample.
Figure 4. Cross plots of 24 measured and calculated P-wave velocities of whole core samples versus permeability. The curves represent six flow units. The numbers in the plot are squirt-flow lengths in millimeters. Each curve represents a flow zone indicator (FZI) calculated with the expression FZl = 0.314k/where is porosity and k is permeability. The curves show that P-wave velocity decreases as permeability increases. Also, as permeability increases, squirt-flow length increases as well, i.e., a large permeability correlates with large flow lengths. The plots suggest that differences between observed and calculated velocities are due to the presence of vuggy porosity in the cores. We expect that the increase in permeability with squirt-flow length reflects the presence of connected vugs.
Figure 5. Attenuation and phase velocity curves based on whole core samples associated with the P-wave velocity versus permeability curve (b) in Figure 4. Responses are calculated for squirt-flow lengths of 8 and 15 mm. In general, the curves show strong dispersion effects caused by interactions between the rock matrix and water. Strong attenuations exist between 1000-15,000 Hz. In the attenuation curves, the peak frequency moves toward the low frequency range as the squirt-flow increases. This analysis implies that sonic logs and attenuation tomography have the potential to capture fluid flow interactions between the rock matrix and the vugs. Specifically, P-wave attenuation and velocity dispersion can capture the degree of connectivity between vugs, or between the matrix porosity and vugs.
Figure 5. Attenuation and phase velocity curves based on whole core samples associated with the P-wave velocity versus permeability curve (b) in Figure 4. Responses are calculated for squirt-flow lengths of 8 and 15 mm. In general, the curves show strong dispersion effects caused by interactions between the rock matrix and water. Strong attenuations exist between 1000-15,000 Hz. In the attenuation curves, the peak frequency moves toward the low frequency range as the squirt-flow increases. This analysis implies that sonic logs and attenuation tomography have the potential to capture fluid flow interactions between the rock matrix and the vugs. Specifically, P-wave attenuation and velocity dispersion can capture the degree of connectivity between vugs, or between the matrix porosity and vugs.
Figure 6(a). (a) Pore size distribution for core 41 based on multiple imaging methods. The two SEM magnifications and the OM image have overlapping scales of view, so there is a continuous distribution of pore sizes from 0.02 µm up to 50 µm. From pore size distribution, we can predict T2 distribution.
Figure 6(b). (b) Predicted T2 distribution from the core in the absence of any bulk relaxation. In this case, about half of the porosity is distributed at T2 decay times much longer that those recorded by the tool.
Figure 6 (c). (c) By including a bulk relaxation time (Tb) of .5 seconds, the large pores are moved within the T2 distribution. As a result a good fit between the NMR well log and synthetic signatures are obtained. This results shows that Tb is an important parameter that it should not be neglected in the analysis of vuggy carbonates.Matching the peaks of the pore size histogram and the well log T2 distribution suggests that formation relaxivity is near 1.5 µm/s. This is within the range of acceptable values for carbonates.
Approximate breakdown of porosity by imaging method and porosity type CT (vuggy) = 13% OM (macro) = 4% SEM (micro) = 17% Total porosity from imaging = 33%* Porosity from core = 32% Porosity from well log = 39% *Numbers do not add exactly because of overlap in SEM and OM length scales.
Figure 7. Comparison ofNMR core signatures with OM thin sections for cores 4, 6, 21, 32 and 49. The NMR plots contain the T2 relaxation distributions for both desaturated and fully saturated samples overlain on one plot. The NMR measurements were made for small plugs having different permeabilities and porosities than the whole cores.
Figure 7 con’t. Core # 4 is a limestone of grainstone texture with intergranular pores and vugs. The saturated T2 distribution exhibits two pore size peaks at 40 ms and 1000 ms. The photomicrographs show localized vugs that are separated. The T2 distribution reflects the presence of the separate vugs (at 1000 ms) and the intergranular pore size (40 ms). The plug permeability is 158 md, and the whole core permeability is 1235 md. A heterogeneous sample.
Figure 7 con’t. Core # 6 is a limestone of grainstone texture with no vugs and with poorly interconnected moldic pores. The T2 exhibits a peak at 12 ms, which corresponds to the matrix porosity of the grainstone sample. The permeability of this plug is close to zero, and the permeability of the whole core is 0.7 md. A homogenous sample.
Figure 7 con’t. Core # 21 is a sandstone with an average grain size of 0.095 mm. Intergranular pores (igp) with dolomite cement dominate the pore system. The T2 distribution peak at 12 ms reflects the matrix porosity of the sample. A low permeability, homogenous sample (average permeability of the plug is 31 md and of the whole core is 86 md).
Figure 7 con’t. Core # 32 is a limestone of poorly-preserved packstone texture. Moldic and intraparticle pores can be identified. The T2 distribution has a peak at about 400 ms, which corresponds to large pore size (vuggy porosity). The sample is heterogeneous. The plug permeability is 220 md, and the whole core permeability is 1805 md.
Figure 7 con’t. Core # 49 is limestone of packstone texture. The pore system comprises common intraparticle and intergranular pores, with moderate amounts of intercrystalline pores. The T2 peak is at 80 ms, which corresponds to moderate pore sizes. The permeability of the plug is 13 md, and the permeability of the whole core is 98 md. The sample is relatively homogeneous.
Figure 8. NMR measurements performed on 18 saturated and desaturated core samples provided the information to produce T2 relaxation cut-off times (T2c) for use in log calibration. Different relaxation rates are observed in the data associated with the different rock groups in the well, which provides the appropriate bound-volume index (BVI) for each core plug. Models based on flow zone indicator (FZI), NMR derived porosity, and the BVI parameter provide the relationship to calculate permeability at the core scale.
Figure 9. Four T2c, selected from cores and the permeability equation given in Figure 8, provide the calibration parameters to produce NMR-derived permeability in the middle track above. Here the far right plot shows the T2 distribution in the color scale and overlain red lines. The white log is the median T2 value, which is used with porosity to discriminate among relaxivity units. The thick red line is the variable T2 cut-off. For comparison, this figure shows the lithology, porosity and the Vp and Vs logs.
Figure 10 con’t. Permeability data is related to interwell velocity data based on multiple offset high resolution seismic measurements recorded between the PBF10 and PBF13 wells at the western Hillsboro site, Palm Beach, Florida. Crosswell tomography and reflection images were gathered at the site. We focus on the P-wave velocity image data, illustrated here with the gamma ray and Vp well logs. The P-wave velocity extracted from the tomography data set is plotted as a velocity log at both sides of the interwell velocity image. There is a correlation between the velocity logs at the two scales (10 kHz and 1 kHz), the gamma ray logs, and the image data. The difference between the velocity logs at the two dominant frequencies is due to dispersion. Based on the poroelastic modeling shown in Figure 5, we expect that most of the velocity dispersion between the acoustic and seismic data is due to the permeable rock formation in the region between 1060 to about 1180 feet. Some of the velocity dispersion is due to scattering losses associated with lithological changes.
Figure 11 con’t. Cross Plots Between Permeability and Porosity with P-wave Velocity Since there is a good correlation between P-wave velocity and permeability at the core scale, as shown in Figure 4, we correlate the Vp with the NMR-derived permeability and with the total porosity log. The computed relations are shown in Figure 11. The figure shows nonlinear relationships between the Vp and the permeability in the permeable Ocala carbonates (1070-1200 ft) and in the Arcadia Formation at depth intervals of 950-1010 ft and 1025-1045 ft. Figure 11 also shows linear relationships between Vp and the total porosity in both regions.
Figure 12. Permeability and Porosity Images. The comparison of the permeability log with the lithology shows a very low permeability in the sandstone, and a moderated permeability low in the chalky carbonate. The high permeability values correlate with the carbonate with interparticle porosity, which is consistent with the core data. The permeability and porosity equations are applied to the velocity pixels to produce the permeability and porosity images. Here we compare the lithology with the velocity, porosity and permeability images between 950-1200 ft. A permeable zone between 1100-1200 ft in the interwell region of wells PBF10 and PBF13 is developed at well PBF10 and decreases toward well PBF13.
Conclusions Ultrasonic responses based on CT models is a practical technique to determine the heterogeneous conditions of the rock fabric and the applicability of acoustics to describe the aquifer formation. The results of the analysis of the observed and calculated ultrasonic responses leads to correlations of P-wave velocity and permeability at the core scale. This suggests that the velocity can be related to permeability at the borehole and the interwell scales. This concept was supported with poroelastic modeling by showing the velocity dispersion in the frequency range between 1 -250 kHz. Furthermore, excellent correlations between P-wave velocity and porosity and P-wave velocity and permeability at the borehole scale demonstrate that indeed fluid flow effects can be related to velocity dispersion. These results have inferred that velocity images at the interwell scale can be converted to permeability and porosity distributions between wells PBF 10 and PBF 13. The velocity, porosity and permeability images correlates with the gamma ray and the velocity logs. The velocity dispersion between the Vp log and the tomography log that is observed in the permeable region suggests that attenuation tomography also can be used to map fluid flow effects in South Florida aquifers.
Conclusions con’t. Comparisons of the plug and whole core permeability measurements suggest the presence of permeability heterogeneity at these two scales. This heterogeneous condition suggests that NMR whole core measurements will provide more representative permeability information than that from plugs. The thin section analysis and core analysis shown that the NMR well log derived permeability represents the matrix permeability. Although the NMR well log calibration based on plugs apparently underestimated the true permeability of the vuggy formation, the relative permeability correlates with the lithology in the region between 1000-1200 ft. This study demonstrates that NMR and acoustic techniques complement each other to characterize vuggy carbonate formations at the borehole scale. The final results demonstrate that seismic techniques can be used to map permeability distributions in the carbonate aquifer in the Ocala Limestone Formation in Palm Beach, South Florida.
Acknowledgement This work was performed with support from the U.S. Department of Energy (DOE), under contract no. DE-AC26-99BC15203. The assistance of Mr. Purna Halder is gratefully appreciated.