Multiple Linear Regression
Multiple Linear Regression. Purpose . To analyze the relationship between a single dependent variable and several independent variables. Key terms. Bivariate Partial Correlation : Simple correlation between two variables after the effects of all other variables is removed


Multiple Linear Regression
E N D
Presentation Transcript
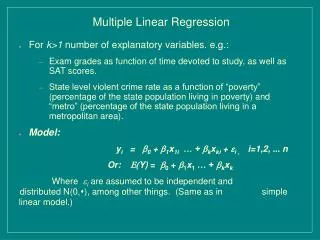
Purpose • To analyze the relationship between a single dependent variable and several independent variables
Key terms • Bivariate Partial Correlation: Simple correlation between two variables after the effects of all other variables is removed • Correlation: how a change in one variable affects another variable • Strength • Direction • Dependent variable: criterion • Independent variable: predictor
Key terms • Regression variate: a linear combination of the independent variables used to attempt to predict the dependent variable • Beta coefficient: standardized regression coefficient that allows for a direct comparison between variables as to their relative explanatory power of the dependent variable
Key Terms • Correlation Coefficient R: degree to which two or more predictors are related to the criterion. Measure applied to the variate. • Coefficient of determination R square: Measure of the proportion of the variance of the criterion that is explained by the predictors. Measure applied to the variate.
Key terms • Residual Variance and R-square. This value is immediately interpretable in the following manner. If we have an R-square of 0.4 then we know that the variability of the Y values around the regression line is 1-0.4 times the original variance; in other words we have explained 40% of the original variability, and are left with 60% residual variability. Ideally, we would like to explain most if not all of the original variability. The R-square value is an indicator of how well the model fits the data (e.g., an R-square close to 1.0 indicates that we have accounted for almost all of the variability with the variables specified in the model).
Steps • First interpret the variate. If the variate is NOT significant, stop. If it is significant, then you can interpret the Betas and R square values. • Use the Betas to answer your hypotheses.