Download

1 / 74
750 likes | 1.17k Views
Customer Measurement in ORS. Performance Management Conference Amy Culbertson, M.S. Office of Quality Management 31 October 2001. Overview. Customer Relationship Management The 10 Steps Conclusion. Customer Relationship Management (CRM). Customer measurement a piece of CRM

E N D
Customer Measurement in ORS Performance Management Conference Amy Culbertson, M.S. Office of Quality Management 31 October 2001
Overview • Customer Relationship Management • The 10 Steps • Conclusion
Customer Relationship Management (CRM) • Customer measurement a piece of CRM • Describes the many activities in managing relationships with customers • What is a relationship? • Continuing series of collaborative interactions • Occurs over time • Develops based on successive interactions • Unique for each customer • Why management? • Each interaction offers: • Ability to customize products/services to customers • Opportunity to influence customers’ percpetions • Learn more about customers for the future • Management of relationship encourages loyalty
© 2001 The New Yorker Collection from cartoonbank.com. All Rights Reserved.
Why should YOU care about managing customers? • Times have changed • Customers have escalating needs • Competitors are delivering on these demands • If you don’t, you will be out of business • Computer technology has contributed to this new world • Business Case • Dissatisfied customers usually don’t complain • Dissatisfied customers usually do defect • Dissatisfied customers tell everyone they know • Dissatisfied customers encourage others to defect • Result --- lost business…..forever!!
Why should ORS care about managing customers? • Management Case • ORSAC wants to see data • How ORS knows we are satisfying customers • Why ORS should be the provider of choice • How ORS is planning to meet future customer needs • Government Case • Should ORS be sole source of products/services • Can others (gov or private) be providers • Cost important but also value • GPRA • Explain in quantifiable terms how serving customers • Value provided in fulfilling Agencies’ missions • Why we should continue to receive funding and support
If you can’t measure it, you can’t manage it.
Where do you start? © 2001 The New Yorker Collection from cartoonbank.com. All Rights Reserved.
The 10 Steps • Select the service area to measure • Define products/services delivered to customers • Identify customer segments • Conduct targeted customer interactions • Research competitors • Select measures • Plan data collection • Gather and analyze customer data • Discuss findings and recommendations • Take action
Step 1: Select Service Areas to Measure • Best to prioritize areas to measure • Select those that are most important • Visibility to customers • Complaints concerning quality • Revenue generated • High costs of operations • Desire to understand why product/service is successful • Initiatives to increase market share • Requests to demonstrate service usefuless
Step 2: Describe Products/Services © 2001 The New Yorker Collection from cartoonbank.com. All Rights Reserved.
Step 2:Describe Products/Services Being Delivered • Some questions to answer: • What categories of products/services are delivered to customers? • Why are some categories used more than others? • Has the delivery of products/services increased, decreased, or remained constant? • Why have these changes occurred? • Are particular NIH ICs using the product/service more than others? • If so, why? • Who is ordering, receiving, and using the products/services? • Do your IT systems provide enough information to answer these questions?
Graph what You Deliver to Customers • Example 2-1 • Printing and Reproduction Sales Data by Fiscal Year • Example 2-2 • DES Shops Fee for Service Sales by Fiscal Year • Example 2-3 • Categories of Products Ordered from MAPB by Year • Example 2-4 • NIH ID Cards Issued by Year • Example 2-5 • Flow Chart of the Staffing Process in ORS
Example 2-1Printing and Reproduction Sales Data by Fiscal Year
Step 3: Identify Customer Segments Not all customers are the same……
Step 3:Identify Customer Segments • Segmentation means to sort customers into groups based on similar characteristics • Critical to the viability of service organizations • Segmentation allows understanding of the differences in customer groups • What they like - what they don’t like • How to tailor service offerings to better meet needs of each group • By identifying and tracking customer segments over time • Determine which segments are most profitable to target and retain • Determine which segments to deemphasize
How do I Segment my Customers? Use existing data to undestand: • Type of products/services used • Quantities of use • Customer’s organization • Customer’s function • Other demographic variables • Location • Type of business • Delivery schedule
Graph Data to Understand Customer Segments • Example 3-1 • ORS Customer Segments Matrix Data for 41 Discrete Services in FY01 • Example 3-2 • MAPB Sales by NIH IC for FY00 - Top Ten NIH ICs • Example 3-3 • Printing and Reproduction Sales by Fiscal Year - Top Five NIH ICs • Example 3-4 • NIH Dining Centers - Customer Segments
Example 3-3Printing and Reproduction Sales by Fiscal YearTop Five NIH ICs
Step 4: Conduct Targeted Customer Interactions © 2001 The New Yorker Collection from cartoonbank.com. All Rights Reserved.
Step 4:Conduct Targeted Customer Interactions • Existing data may not reveal what matters most to customers • Take time to measure the right things • Targeted interactions allow you to learn more about your customers • First review data from prior steps • Look at additional sources - complaints • Develop list of questions • Go talk with customers • Be open to whatever they want to discuss • Example 4-2 • Questions for Targeted Interactions with Conference Services Customers
Step 5: Research Competitors © 2001 The New Yorker Collection from cartoonbank.com. All Rights Reserved.
Step 5:Research Your Competitors • Why should ORS be the provider of choice? • Ask yourself: • Who else can provide this service? • At what cost can others provide this service? • What does ORS offer that is unique or valued compared to competitors? • What do competitors offer in terms of features and amenities that are not offered by ORS? • What distinguishes you from your competitors? • What are you doing to increase market share? • Example 5-1 • Market Research for Printing Services in ORS
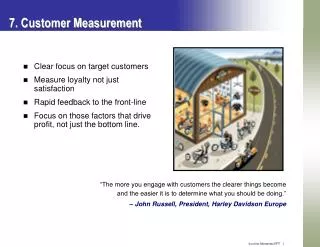
Typical Balanced Scorecard Customer Measures • Customer satisfaction • How well meeting needs and satisfaction with specific performance criteria • Market share • Proportion of business in market that you provide to customers • Customer retention • Do you maintain ongoing relationships with customers and retain their business • Customer acquisition • Rate at which you attract new customers • Customer profitability • Net profit of a customer segment accounting for unique expenses to support that customer
Some Advice About “Measures” • Rarely can you gather data and use it directly to gauge performance • Data needs to be collected, transformed, analyzed, summarized, and displayed • Most measures are calculated based on a series of raw data metrics • Customer satisfaction may be the overall satisfaction score on a 20 question survey • Market share may be combination of percentage of market for variety of products/services • Customer retention may be combination of retention of many different customers, segments • There is no one “right” measure • Be flexible to change measures • Example 6-1 • Customer Survey Results of the Eurest Dining Centers
Example 6-1Customer Survey Results of the Eurest Dining Centers
Step 7: Plan Data Collection © 2001 The New Yorker Collection from cartoonbank.com. All Rights Reserved.
THINK Before you Act! • Data collection is a time consuming activity • Gathering data from customers raises their expectations • Only collect the amount of data you can analyze and respond to in timely fashion • Garbage in = Garbage out
Methods for Collecting Data • Existing Data • Observation • Interviews and Focus Groups • Surveys
Existing Data • Financial data, ordering data, delivery data, complaints data • Steps to using existing data: • Select appropriate data • Define data into measures • Determine computational procedures to use measures as information • Example 7-1 • SEIB Sales Data by Product by Year
Existing Data - Advantages • Easy to gather • Doesn’t require involving the customer • Often viewed as “objective” or “real” • Can be summarized over time • Allows quick review of current situation • Typically used to convince management that something needs to change
Existing Data - Disadvantages • Quality of the data may be poor - not recorded in consistent fashion • Data may be incomplete • Extraction of data may be time consuming • Not collected with analysis in mind • May have limited usefulness
Observations • Simple to do • Great reality check on how things really happen • Very useful to understand new features, amenities you could provide • Example 7-2 • Observations of the Print Ordering Process
Observations - Advantages • Yield real time data • Provide understanding of context • Outsiders can be used so data has little bias • See things that escape notice in general course of work • Access to information people may not want to discuss in interviews
Observations - Disadvantages • Can be costly if have to train observers • Limitations due to people’s concerns about anonymity and being observed • Presence of observer may influence process • Can be hard to code and analyze
Interviews and Focus Groups • Difference • Interviews are conducted with individuals • Focus groups consist of multiple participants • Good for collecting qualitative data • Information not readily categorized and coded • Explore why customers feel they way they do • Questions are usually open-ended in nature • Let customers respond in their own words • Provides insight into customer perceptions • Example 7-3 • Focus Groups of Conference Services Customers
Interviewing is a Skill © 2001 The New Yorker Collection from cartoonbank.com. All Rights Reserved.
Interviews/Focus Groups - Advantages • Allow flexibility in data collection • Can gather unexpected data and ask unplanned questions • Provide more complete customer perspective • Facilitate communication and customer relations • Useful for generating ideas for improvement • Allow for problem-solving during the actual meeting
Interviews/Focus Groups - Disadvantages • Require skilled interviewers or they can backfire • Produce results that can be difficult to analyze and interpret with assistance • Can produce biased results • Social desirability or peer pressure (focus groups) can be influential
Surveys • Doing a good survey is NOT simple • Obtaining useful information requires skill and practice • The method (e.g. doing a web survey) is just part of the process • Need to consider issues of anonymity and confidentiality • There is no “magical” number of questions • Response rates are key to evaluating surveys -- how their data can be used • Don’t do a survey unless you plan to act on the results
Components of a Survey • Introduction • Demographic questions • Example 7-4 • Background Questions • Ratings on performance characteristics • Example 7 - 5 • Customer Satisfaction Survey Questions • Ratings of satisfaction and importance • Example 7-6 • Customer Survey Questions of Satisfaction and Importance
Components of a Survey(cont.) • Check all that apply questions • Example 7-7 • Reasons for Not Using Services • Yes-No-Don’t know questions • Example 7-8 • Meeting Events in NIH Conference Rooms • Open-ended questions • Example 7-9 • NIH Customer Survey -- Eurest Dining Centers • Putting it all together • Example 7-9 • NIH Customer Survey -- Eurest Dining Centers
Survey Sampling and Administration • Sampling is for statisticians • Define population/sampling frame/actual sample • Plan for post-stratification weighting procedures • Administration • Web surveys are the way to go • Authentication • Respondent control • Branching • Data validation • Point of sale surveys • Don’t necessarily generalize to the larger population • Good for tapping current customers • Effective method to solicit improvement ideas • Mail surveys • Response rates and incentives