Download
1 / 69
710 likes | 1.38k Views
Chapter 5 Biodiversity, Species Interactions, and Population Control. Core Case Study: Southern Sea Otters: Are They Back from the Brink of Extinction?. Habitat Hunted: early 1900s Partial recovery Why care about sea otters? Ethics Tourism dollars Keystone species. Southern Sea Otter.

E N D
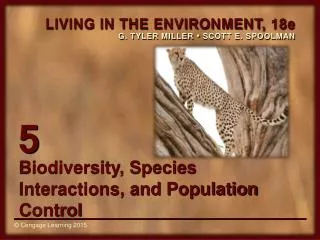
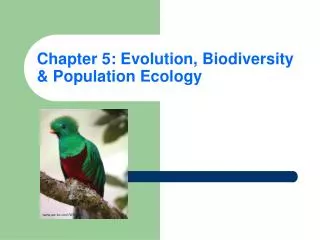
Chapter 5 Biodiversity, Species Interactions, and Population Control
Core Case Study: Southern Sea Otters: Are They Back from the Brink of Extinction? • Habitat • Hunted: early 1900s • Partial recovery • Why care about sea otters? • Ethics • Tourism dollars • Keystone species
Southern Sea Otter Figure 5.1: An endangered southern sea otter in Monterey Bay, California (USA), uses a stone to crack the shell of a clam (left). It lives in a giant kelp bed (right). Scientific studies indicate that the otters act as a keystone species in a kelp forest system by helping to control the populations of sea urchins and other kelp-eating species. Fig. 5-1a, p. 104
5-1 How Do Species Interact? • Concept 5-1 Five types of species interactions—competition, predation, parasitism, mutualism, and commensalism—affect the resource use and population sizes of the species in an ecosystem.
Species Interact in Five Major Ways • Interspecific Competition • Predation • Parasitism • Mutualism • Commensalism
Most Species Compete with One Another for Certain Resources • For limited resources • Ecological niche for exploiting resources • Some niches overlap
Some Species Evolve Ways to Share Resources • Resource partitioning • Using only parts of resource • Using at different times • Using in different ways
Resource Partitioning Among Warblers Figure 5.2:Sharing the wealth: This diagram illustrates resource partitioning among five species of insect-eating warblers in the spruce forests of the U.S. state of Maine. Each species minimizes competition with the others for food by spending at least half its feeding time in a distinct portion (yellow highlighted areas) of the spruce trees, and by consuming somewhat different insect species. (After R. H. MacArthur, “Population Ecology of Some Warblers in Northeastern Coniferous Forests,”Ecology 36 (1958): 533–536.) Fig. 5-2, p. 106
Specialist Species of Honeycreepers Figure 5.3:Specialist species of honeycreepers: Through natural selection, different species of honeycreepers developed specialized ecological niches that reduced competition between these species. Each species has evolved a specialized beak to take advantage of certain types of food resources. Fig. 5-3, p. 107
Most Consumer Species Feed on Live Organisms of Other Species (1) • Predators may capture prey by • Walking • Swimming • Flying • Pursuit and ambush • Camouflage • Chemical warfare
Predator-Prey Relationships Fig. 5-4, p. 107
Most Consumer Species Feed on Live Organisms of Other Species (2) • Prey may avoid capture by • Run, swim, fly • Protection: shells, bark, thorns • Camouflage • Chemical warfare • Warning coloration • Mimicry • Deceptive looks • Deceptive behavior
Some Ways Prey Species Avoid Their Predators Figure 5.5: These prey species have developed specialized ways to avoid their predators: (a, b) camouflage, (c–e) chemical warfare, (d, e) warning coloration, (f) mimicry, (g) deceptive looks, and (h) deceptive behavior. Fig. 5-5, p. 109
camouflage (a) Span worm Fig. 5-5a, p. 109
camouflage (b) Wandering leaf insect Fig. 5-5b, p. 109
chemical warfare (c) Bombardier beetle Fig. 5-5c, p. 109
chemical warfare (d) Foul-tasting monarch butterfly Fig. 5-5d, p. 109
warning coloration (e) Poison dart frog Fig. 5-5e, p. 109
warning coloration (f) Viceroy butterfly mimics monarch butterfly Fig. 5-5f, p. 109
mimicry (g) Hind wings of Io moth resemble eyes of a much larger animal. Fig. 5-5g, p. 109
mimicry (h) When touched, snake caterpillar changes shape to look like head of snake. Fig. 5-5h, p. 109
(a) Span worm (b) Wandering leaf insect (c) Bombardier beetle (d) Foul-tasting monarch butterfly (f) Viceroy butterfly mimics monarch butterfly (e) Poison dart frog (g) Hind wings of Io moth resemble eyes of a much larger animal. (h) When touched, snake caterpillar changes shape to look like head of snake. Stepped Art Fig. 5-5, p. 109
Science Focus: Threats to Kelp Forests • Kelp forests: biologically diverse marine habitat • Major threats to kelp forests • Sea urchins • Pollution from water run-off • Global warming
Purple Sea Urchin Fig. 5-A, p. 108
Predator and Prey Interactions Can Drive Each Other’s Evolution • Intense natural selection pressures between predator and prey populations • Coevolution • Interact over a long period of time • Bats and moths: echolocation of bats and sensitive hearing of moths
Coevolution: A Langohrfledermaus Bat Hunting a Moth Fig. 5-6, p. 110
Some Species Feed off Other Species by Living on or in Them • Parasitism • Parasite is usually much smaller than the host • Parasite rarely kills the host • Parasite-host interaction may lead to coevolution
Parasitism: Trout with Blood-Sucking Sea Lamprey Fig. 5-7, p. 110
In Some Interactions, Both Species Benefit • Mutualism • Nutrition and protection relationship • Gut inhabitant mutualism • Not cooperation: it’s mutual exploitation
Mutualism: Hummingbird and Flower Figure 5.8:Mutualism: This hummingbird benefits by feeding on nectar in this flower, and it benefits the flower by pollinating it. Fig. 5-8, p. 110
Mutualism: Oxpeckers Clean Rhinoceros; Anemones Protect and Feed Clownfish Figure 5.9: Examples of mutualism: (a) Oxpeckers (or tickbirds) feed on parasitic ticks that infest large, thick-skinned animals such as the endangered black rhinoceros. (b) A clownfish gains protection and food by living among deadly, stinging sea anemones and helps to protect the anemones from some of their predators. Fig. 5-9, p. 111
In Some Interactions, One Species Benefits and the Other Is Not Harmed • Commensalism • Epiphytes • Birds nesting in trees
5-2 What Limits the Growth of Populations? • Concept 5-2 No population can continue to grow indefinitely because of limitations on resources and because of competition among species for those resources.
Most Populations Live Together in Clumps or Patches (1) • Population: group of interbreeding individuals of the same species • Population distribution • Clumping • Uniform dispersion • Random dispersion
Most Populations Live Together in Clumps or Patches (2) • Why clumping? • Species tend to cluster where resources are available • Groups have a better chance of finding clumped resources • Protects some animals from predators • Packs allow some to get prey
Population of Snow Geese Fig. 5-11, p. 112
Generalized Dispersion Patterns Figure 5.12: This diagram illustrates three general dispersion patterns for populations. Clumps (a) are the most common dispersion pattern, mostly because resources such as grass and water are usually found in patches. Where such resources are scarce, uniform dispersion (b) is more common. Where they are plentiful, a random dispersion (c) is more likely. Question: Why do you think elephants live in clumps or groups? Fig. 5-12, p. 112
Populations Can Grow, Shrink, or Remain Stable (1) • Population size governed by • Births • Deaths • Immigration • Emigration • Population change = (births + immigration) – (deaths + emigration)
Populations Can Grow, Shrink, or Remain Stable (2) • Age structure • Pre-reproductive age • Reproductive age • Post-reproductive age
Some Factors Can Limit Population Size • Range of tolerance • Variations in physical and chemical environment • Limiting factor principle • Too much or too little of any physical or chemical factor can limit or prevent growth of a population, even if all other factors are at or near the optimal range of tolerance • Precipitation • Nutrients • Sunlight, etc
Trout Tolerance of Temperature Figure 5.13: This diagram illustrates the range of tolerance for a population of organisms, such as trout, to a physical environmental factor—in this case, water temperature. Range of tolerance restrictions prevent particular species from taking over an ecosystem by keeping their population size in check. Question: For humans, what is an example of a range of tolerance for a physical environmental factor? Fig. 5-13, p. 113
No Population Can Grow Indefinitely: J-Curves and S-Curves (1) • Size of populations controlled by limiting factors: • Light • Water • Space • Nutrients • Exposure to too many competitors, predators or infectious diseases
No Population Can Grow Indefinitely: J-Curves and S-Curves (2) • Environmental resistance • All factors that act to limit the growth of a population • Carrying capacity (K) • Maximum population a given habitat can sustain
No Population Can Grow Indefinitely: J-Curves and S-Curves (3) • Exponential growth • Starts slowly, then accelerates to carrying capacity when meets environmental resistance • Logistic growth • Decreased population growth rate as population size reaches carrying capacity
Logistic Growth of Sheep in Tasmania Figure 5.15: This graph tracks the logistic growth of a sheep population on the island of Tasmania between 1800 and 1925. After sheep were introduced in 1800, their population grew exponentially, thanks to an ample food supply and few predators. By 1855, they had overshot the land’s carrying capacity. Their numbers then stabilized and fluctuated around a carrying capacity of about 1.6 million sheep. Fig. 5-15, p. 115
Science Focus: Why Do California’s Sea Otters Face an Uncertain Future? • Low biotic potential • Prey for orcas • Cat parasites • Thorny-headed worms • Toxic algae blooms • PCBs and other toxins • Oil spills
Population Size of Southern Sea Otters Off the Coast of So. California (U.S.) Figure 5.B: This graph tracks the population size of southern sea otters offthe coast of the U.S. state of California, 1983–2009. According to the U.S. Geological Survey, the California southern sea otter population would have to reach at least 3,090 animals for 3 years in a row before it could be considered for removal from the endangered species list. (Data from U.S. Geological Survey) Fig. 5-B, p. 114
Case Study: Exploding White-Tailed Deer Population in the U.S. • 1900: deer habitat destruction and uncontrolled hunting • 1920s–1930s: laws to protect the deer • Current population explosion for deer • Spread Lyme disease • Deer-vehicle accidents • Eating garden plants and shrubs • Ways to control the deer population
Mature Male White-Tailed Deer Fig. 5-16, p. 115
When a Population Exceeds Its Habitat’s Carrying Capacity, Its Population Can Crash • A population exceeds the area’s carrying capacity • Reproductive time lag may lead to overshoot • Population crash • Damage may reduce area’s carrying capacity