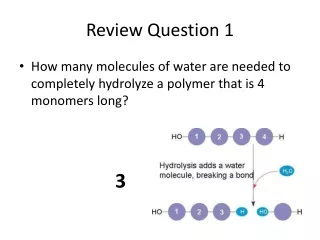
Review question
Review question. How does hail form? What factors govern the ultimate size of hailstones?. Hail is produced only in cumulonimbus clouds where updrafts and downdrafts are strong and where there is an abundant supply of supercooled water.


Review question
E N D
Presentation Transcript
Review question How does hail form? What factors govern the ultimate size of hailstones? Hail is produced only in cumulonimbus clouds where updrafts and downdrafts are strong and where there is an abundant supply of supercooled water. Hailstones begin as tiny ice pellets that grow by collecting supercooled cloud droplets as they fall through the cloud. If a strong updraft is encountered, the hail may be carried upward again and begin the descent anew.
Review question For surface low pressure to exist for an extended period of time, what condition must exist aloft? In order for surface low pressure to exist for a reasonable period of time, compensation must occur aloft. Surface pressure would be maintained if divergence aloft occurs at a rate equal to the inflow below.
Review question Distinguish between macroscale, mesoscale and microscale winds. Give an example of each. Macroscale winds, the largest wind pattern, involve a time scale of from days to years (hurricanes, mean global flow). Mesoscale winds involve a time scale of from minutes to days and include local winds such as the sea breeze as well or weather phenomena such as tornadoes. Microscale winds are very short-lived winds (from seconds to minutes) and involves such things as turbulence (wind gusts).
Review question What are two possible ways a blocking high might influence the weather? Blocking highs can block the eastward migration of cyclones, keeping one region dry and keeping another region continually under the influence of cyclone storms. Another influence of blocking highs is their contribution to air pollution episodes. This can happen as subsidence within an anticyclone can produce a temperature inversion and light winds associated with the center of an anticyclone do little to disperse polluted air.
Synoptic Weather Forecasting • Until the late 1950’s synoptic weather forecasting was the • primary basis for weather prediction. Forecasters relied • heavily on synoptic weather maps to forecast. • Other methods of weather forecasting include: • Persistence Forecasting: yesterday’s weather today • Trend Forecasting: similar to persistence with slight changes in • previous day’s weather • Analog Approach: current weather conditions are matched with • records of similar past weather events (Model Output Statistics).
Electronic Numerical Integrator And Computer The ENIAC machine occupied a room thirty by fifty feet. The controls are at the left, and a small part of the output device is seen at the right.
Eta Model Vertical Resolution Characteristics/Layer Distribution
Numerical Weather Prediction • Weather prediction models initiate with observations of the current state of the atmosphere and then use equations to compute new values at 5-10 minute intervals, called time steps. Predicted values serve as the next set of initial conditions for the next series of computations. • The weather models are not perfect representations of the • atmosphere. This is so for three basic: • inadequate representation of physical processes • errors in initial observations • inadequate model resolution
Numerical Weather Prediction • Weather prediction models initiate with observations of the current • state of the atmosphere and then use equations to compute new • values at 5-10 minute intervals, called time steps. Predicted values • serve as the next set of initial conditions for the next series • of computations. • The weather models are not perfect representations of the • atmosphere. This is so for three basic: • inadequate representation of physical processes • errors in initial observations • inadequate model resolution
Ensemble Forecasting A forecasting technique that entails running several weather forecasts models, each beginning with slightly different weather information. The forecaster’s level of confidence is based on how well the models agree (or disagree) at the end of some specified time. Scientific and computational limitations prevent us from constructing a perfect numerical model of real systems. In a chaotic system like the atmosphere errors in the initial conditions contribute to the eventual loss of predictive skill. Ensemble forecasting, where not only one but a number of numerical integrations are carried out, was first introduced to assess initial error related variations in predictability
Ensemble Forecasting Dr. Eugenia Kalnay Distinguished University Professor, Department of Meteorology University of Maryland 1965. Ph. D., 1971, MIT (under Jule G. Charney)
Ensemble Forecasting By looking at a number of model runs the forecaster can rule out or give more consideration to a particular weather scenario as well as get a general feel for the variability of a weather pattern. High confidence Low confidence
Propagation of Errors Random Error Random error is the irreproducibility in making replicate measurements and affects the precision of a result. The distribution of random errors follows a Gaussian-shape “bell" curve. The precision is described by statistical methods such as a standard deviation or confidence limit. Systematic Errors Systematic errors are errors that produce a result that differs from the true value by a fixed amount. These errors result from biases introduced by instrumental method, or human factors. Systematic errors can sometimes be identified and corrected.
Propagation of Errors Giving that many time steps are needed to produce a forecast, the problem of “propagation of errors” is a constraint on weather forecasting. Small errors may make little difference in the early stages of prediction, can amplify dramatically over time. Yt = (a x Yt+1) – Y2t
Tools in Weather Forecasting • ASOS Automated Surface Observations • AWIPS Advanced Weather Interactive Processing Systems • NEXRAD Next Generation Radar (Doppler) • Satellites
Satellite Observations and remote sensing The last 25 years have seen an explosion of remote weather products. One advantage to these systems is that they provide continuous data collection which allows observation changes in the atmosphere over several time scales. Satellite Automated Surface Observing System Radar Challenge to design forecast models which take advantage of constant data stream.
Radar An electronic instrument used to detect objects (such as falling precipitation) by their ability to reflect and scatter microwaves back to a receiver.
NEXRAD (Next Generation Radar) In 1988, the NEXRAD Agencies established the WSR-88D (Weather Surveillance Radar 88 Doppler) Radar Operations Center (ROC) in Norman, Oklahoma. The NEXRAD network provides significant improvements in severe weather and flash flood warnings, air traffic safety, flow control for air traffic, resource protection at military bases, and management of water, agriculture, forest, and snow removal.
WIND PROFILER The wind profiler is a ground based array of multiple beam Doppler radar units which measures and displays wind information up to an altitude of 16 km. This instrument is generally used to detect low level wind shear.
Automated Surface Observing System (ASOS) / Automated Weather Observing System (AWOS) Automated Weather Observing System (AWOS) is a suite of sensors, which measures, collects and broadcasts weather data to help meteorologists, pilots and flight dispatchers prepare and monitor weather forecasts, plan flight routes, and provide necessary information for correct takeoffs and landings. Automated Surface Observing System • The data collected by the AWOS may include: • Wind speed, direction, and gusts • Temperature and dew point • Cloud height and coverage • Visibility • Present weather (rain, drizzle, snow) • Rain accumulation • Thunderstorms and lightning • Altimeter • Fog, mist, haze, freezing fog
Satellites Polar Satellites Polar orbiting satellites orbit the globe at low altitudes (a few hundred km) which allows them to complete one pass in 100 minutes. With such a quick orbit the satellite can capture two sweeps of the globe in 24 hours.
Polar Orbiting Satellite ViewHigh Resolution Picture Transmission(from: Patrick Prokop, Meteorologist, WTOC-TV
Satellites Geostationary Satellites GOES 8 Geostationary satellites were placed in orbit over the equator; they remain fixed over a point. To keep the satellite in place over Earth the satellite must orbit at a farther distance than polar orbiters (35,000 kms). Some resolution is lost but very powerful satellites.
The TIROS Program (Television Infrared Observation Satellite) was NASA's first experimental step to determine if satellites could be useful in the study of the Earth TIROS
1960 2001
The images above show the stark contrast between the first image beamed down from TIROS-1 on April 1, 1960 and the full-color full-Earth images that GOES-8 produces every three hours. But, if it hadn't been for TIROS and the TIROS experiment, there would be no GOES images today.
NESDIS NOAA's National Environmental Satellite,Data and Information Service NESDIS operates the satellites and manages the processing and distribution of millions of bits of data and images these satellites produce daily. The prime customer for the satellite data is NOAA's National Weather Service, which uses satellite data to create forecasts for television, radio, and weather advisory services. NOAA's operational environmental satellite system is composed of: geostationary operational environmental satellites (GOES) for short-range warning and "nowcasting," and polar-orbiting environmental satellites (POES) for longer term forecasting. Both kinds of satellites are necessary for providing a complete global weather monitoring system. The satellites carry search and rescue instruments, and have helped save the lives of about 10,000 people to date. The satellites are also used to support aviation safety (volcanicash detection), and maritime/shipping safety (ice monitoring and prediction).
SARSAT Around the world...around the clock...NOAA proudly stands watch. As an integral part of worldwide search and rescue, NOAA operates the Search & Rescue Satellite Aided Tracking (SARSAT) System to locate those in distress almost anywhere in the world at anytime and in most conditions.The SARSAT system uses NOAA satellites in low-earth and geostationary orbits to detect and locate aviators, mariners, and land-based users in distress. The satellites relay distress signals from emergency beacons to a network of ground stations and ultimately to the U.S. Mission Control Center (USMCC) in Suitland, Maryland. The USMCC processes the distress signal and alerts the appropriate search and rescue authorities to who is in distress and, more importantly, where they are located. Truly, SARSAT takes the "search" out of search and rescue.
Chapter 13 Air Pollution • Brief History of Air Pollution • Sources and Types of Air Pollution
THE JOURNAL OF THE AMERICAN CHEMICAL SOCIETY VOLUME XVII. 1895 AN EXAMINATION OF THE ATMOSPHERE OF A LARGE MANUFACTURING CITY By Charles F. Mabery “….The essential constituents of the atmosphere include oxygen, nitrogen, and carbon dioxide in constant proportions, nitrous and nitric acids, sulphurous and sulphuric acids, dust, soot, moisture, ammonia, and certain other constituents in variable proportions depending upon atmospheric conditions and local influences. The allotropic form of oxygen, ozone is an important constituent of the atmosphere, and probably also hydrogen dioxide….”
A Brief Historical Perspective Air pollutants: Airborne particles and gases occurring in concentrations that endanger the health and well being of organisms or disrupt the orderly functioning of the environment. The atmosphere’s composition of gases is always changing (some gases are changing much faster than others). Natural sources of air pollution have always existed. Some examples of natural air pollution are: volcanic ash, salt particles from the oceans, pollen and spores released by plants, smoke from forest fires and windblown dust.
An important thing to consider when looking at atmospheric gases is not necessarily the concentration but rather the reactivity. Very reactive gases, even though they are not present in “high” concentrations are important. The OH radical is one of the most important species in atmospheric chemistry and global change, as it controls the lifetimes of many important atmospheric species, such as methane and the alternative chlorofluorocarbons. However, because of its high reactivity, the concentration of the OH radical in the atmosphere is very small (typically less than 0.5 parts per trillion by volume) and its lifetime very short (less than 1 second). As a result, accurate measurements of the OH radical in the atmosphere are extremely difficult.
Air Pollution • Some types of air pollution are relatively new some have been • around for centuries. • Smoke pollution, associated with coal burning, was one the first • recorded types. • The problem is associated with a concentration of human activity. • With the dawn of the industrial revolution pollution became a • more serious issue with major cities experiences severe pollution • episodes. In extreme cases, widespread health effects were • experienced. In London in 1952 more than 4000 people died as • the result of a 5 day pollution episode. Most of the people who • died where old, had compromised respiratory systems, or heart • problems.