Download
1 / 1
10 likes | 241 Views
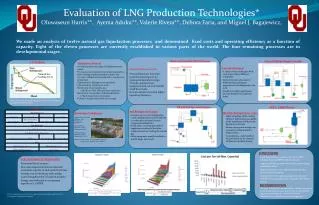
Evaluation of LNG Production Technologies* Oluwaseun Harris**, Ayema Aduku**, Valerie Rivera**, Debora Faria, and Miguel J. Bagajewicz, .

E N D
Evaluation of LNG Production Technologies* Oluwaseun Harris**, Ayema Aduku**, Valerie Rivera**, Debora Faria, and Miguel J. Bagajewicz, We made an analysis of twelve natural gas liquefaction processes and determined fixed costs and operating efficiency as a function of capacity. Eight of the eleven processes are currently established in various parts of the world. The four remaining processes are in developmental stages . Black and Veatch’s PRICO Process ConocoPhillips Simple Cascade T-Q Diagram Simulation Method • Conditions after each stage of refrigeration was noted • Processes were translated into simple simulations • After making simple simulations mimic real process, variables were transferred to real process simulation • Optimization- Refrigerant composition • Optimization- Compressor work • Restriction- Heat transfer area • All cells in LNG HX must have equal area • Restriction- Second law of thermodynamics • Check temperature of streams • Utilities- Acquire water flow rate needed • A series of heat exchangers with each stage using a different refrigerant. • Tailored to take advantage of different thermodynamic properties of the refrigerants to be used. • Usually have high capital costs and can handle very large base loads. Cascade Processes Single Refrigeration cycle • One refrigeration loop that cools the natural gas to its required temperature range. • Usually requires fewer equipment and can only handle small base loads. • Lower capital costs and a higher operating efficiency Natural Gas Cooling Curve Temperature Heat (*) This work was done as part of the capstone Chemical Engineering class at OU (**)Capstone Undergraduate Students Objective of each design: getting the curves closer . It reduces the amount of work needed BP Self Refrigerated Process APCI . C3MR Process Processes Self Refrigerated Cycles Multiple Refrigeration cycles Simulation Techniques • Takes advantage of the cooling ability of hydrocarbons available in the natural gas to help in the liquefaction process. • Numerous expansion stages are required to achieve desired temperatures. • Considered as a safer method because there are no external refrigerants needing storage. • Contains two or more refrigeration cycles. Refrigerants involved could be a combination of mixed or pure component refrigerants. • Some cycles are setup primarily to supplement cooling of the other refrigerants before cooling the natural gas. • More equipment usually involved to handle larger base loads. Natural Gas composition Methane: 0.98 Ethane: 0.01 Propane: 0.01 Inlet conditions Pressure: 750 psia Temperature: 1000F Outlet conditions Pressure: 14.7 psia Temperature: -260oF Capacity: Common min. to max. capacity of process Common min. Capacity: 200,000 lbs/hr Beihai City, China CONCLUSIONS • Each liquefaction process was successfully simulated using SIMSCIPro II software • Capital and Energy costs were determined using simulated values. • Ranking systems were created based on cost, efficiency and capacity. • Connections with existing markettrends were identified, but not all results coincide with thosetrends • Because information on operating conditions is scarce and therefore the process may not be at their global optimum, but rather at a local one , better identification of these optimums is required. Cost and Capacity Relationship Economic Life of 20 years New train required at the documented maximum capacity of each specific process. Average cost of electricity and cooling water throughout the US used in analysis. Energy cost evaluated at a minimum capacity of 1.2 MTPA RECOMMENDATION