Download
1 / 22
220 likes | 668 Views
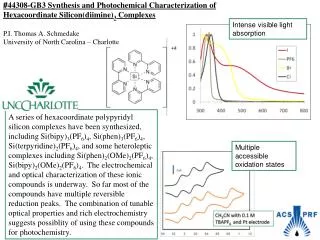
EVALUATION OF INTENSE PULSED LIGHT DEVICES USING STANDARDIZED M ETHODOLOGY. G. Town 1 , C. Ash 2

E N D
EVALUATION OFINTENSE PULSED LIGHT DEVICES USING STANDARDIZED METHODOLOGY G. Town1, C. Ash2 1RPA2000 Laser Protection Adviser, Haywards Heath, United Kingdom2OptoElectronic Engineer, Swansea, Wales, United KingdomThe following potential conflict of interest relationships are germane to my presentation:Financial grant, equipment, consulting feesand travel expenses paid by CyDen Ltd.
Status of FDA devices used for the material being presented: NA/Non-Clinical Status of off-label use of devices, drugs or other materials that constitute the subject of this presentation: NA/Non-Clinical
18 different devices from 15 different manufacturers and 36 applicators (different cut-off filters) from USA, UK, Israel, Sweden, Switzerland, China and Italy were tested by the authors. Data was gathered on-site between patient appointments over a 6-month period in clinics where devices were in daily use. Manufacturers’ information was collected from user manuals, company web sites and literature. Introduction
30 IPL applicators were measured at maximum fluence of which 11 were more than 20% below and 8 were more than 10% above fluence levels given on the device display or claimed in user manuals, even where brand-new lamps were tested. Comparing Fluence Values
9 IPL devices out of 18 had applicators that were outside of the standard formedical Class 4 lasers (> ±20%) Comparing Fluence Values
Only 14 of 29 pulse duration measurements were within ±20% of the manufacturers stated or system-displayed values. Comparing Pulse Duration
Only IPLs ‘E’ and ‘G’ exhibited a true single square pulse shape confirming that they used partial discharge capacitor technology although close pulse-stackingin devices ‘A’ and ‘O’ effectively achieved the same pulse shape and device ‘D’ showed a nearly square pulse shape. Comparing Electrical Discharge Shape IPL ‘E’ IPL ‘G’ IPL ‘C’ IPL ‘A’ IPL ‘Q’ IPL ‘B’
Measurement of UV Content Shorter wavelengths in the ultraviolet region of the spectrum may burn the patient’s skin or may be hazardous to the operator’s eyes and are therefore removed. Of the 30 applicators tested, 6 IPLs measured more than 1% and two measured more than 2% of unwanted UV output below 400 nm when cut-off filters were set significantly higher.
Comparing Average Spectral Output The spectrum analysis of light emitted from flashlamps contains both discrete line structure and continuum radiation. The continuum radiation is blackbody radiation, characteristic of the temperature of the plasma in the discharge. Of 29 applicators 19 (65.5%) with cut-off filters that were inaccurate by more than 20 nm versus the claimed cut-off value given by the manufacturer. Only 10 applicators (34.5%) were within 20 nm of the stated cut-off.
Schematic illustration of the difference in the spatial and temporal characteristics of a free discharge and partial discharge pulse to an IPL xenon lamp. Comparing Time-Resolved Spectral Output
Time-resolved spectrum sampled every 1 ms using an OceanOptics HR2000+ spectrometer and SpectraSuite software to demonstrate the stability and efficiency of spectral output for free-discharge (IPL ‘C’) vs. square pulse systems (IPL ‘E’) IPL ‘C’—Free Discharge IPL ‘E’—Square Pulse
IPL ‘D’ single pulse programs produce a decaying square pulse
IPL ‘D’ in a multi-pulse program showing more pronounced ‘free-discharge’ characteristics
IPL ‘A’ —Free Discharge Close “stacking” of sub-pulses produces a square pulse effect unless sub-pulses are spaced too far apart when they simply perform like conventional free-discharge pulses.
IPL ‘L’ showing sub-pulses in typical ‘free discharge’ format
IPL ‘K’ showing sub-pulses in typical ‘free discharge’ format
IPL ‘C’ showing a typical ‘free discharge’ of ca 3 ms of energy
Many manufacturers of IPLs make claims that are not substantiated as measured by this study Manufacturers operating an ISO 9000 Q/A system (Medical CE-mark) showed greater consistency of stated and actual values for fluence, pulse duration and spectral cut-off filter accuracy over the stated lifetime of the applicator / lamps. Partial Discharge (‘square pulse’) Systems Produce the lowest possible intensity for a given fluence thus minimising discomfort and other side effects such as skin burns (i.e. safer to use) Free Discharge (‘rising/falling slope’) Systems Produce high energy in short pulse durations with spectral shift and wasted energy CONCLUSIONS
CONCLUSIONS • A time-resolved ‘Spectral Footprint’ as shown in these measurements is helpful in determining the true pulse duration and spectral pattern of useful energy for optimized clinical efficiency • This first serious attempt to measure IPL performance characteristics provides criteria that should be carried to national representatives of the competent regulatory body (IEC) to promote an international standard for measuring intense light devices
The authors wish to thank the following companies for their contribution in reviewing the fluence test methodology used in this study:Cyden Ltd., Swansea, Wales, UK(www.cyden.co.uk) Energist Ltd., Swansea, Wales, UK(www.energist-international.com) Instinctive Technologies Ltd., Bedford, UK(www.instinctiveuk.com) Lynton Lasers Ltd., Cheshire, UK(www.lynton.co.uk) Acknowledgements