Download
1 / 6
0 likes | 3 Views
Explore how Copods developed a healthcare sales monitoring app with a focus on experience design, enhancing data analytics and improving sales tracking efficiency<br><br>

E N D
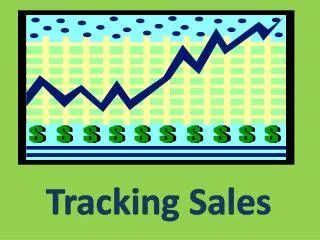
Making Medicine sales tracking and analysis easier to consume We did a visual refresh for Healthcare company product which allowed their users to track and analyse their medicines with respect to competitor performance, market trend & overall sales. ● Navigational structure Redesign ● Wireframing ● Visual Design
The Engagement Strategic Changes for immediate impact Enhance Navigation We made structural changes to enhance navigation, aligning it with standardised patterns to provide a more intuitive and seamless user experience. This ensures users can easily find and access the information they need.
Visual emphasis on the primary content Provided visual emphasis on the primary content which enabled users to focus on the data. Gave more real estate to the main content rather than non informative information on the page
Tableau Integration We seamlessly integrated Tableau into the product, ensuring it feels familiar to users in the medical domain. This allows them to conduct analyses efficiently and comfortably within a trusted environment.
Overall Legibility We made visual enhancements to improve legibility across charts and tables, making data presentation clearer and ensuring that users can read and interpret information more easily.
Read More Our Case Studies — https://www.copods.co/practices