Download
1 / 8
90 likes | 600 Views
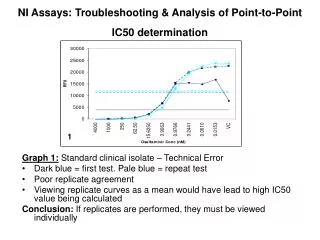
NI Assays: Troubleshooting & Analysis of Point-to-Point IC50 determination. 1. Graph 1: Standard clinical isolate – Technical Error Dark blue = first test. Pale blue = repeat test Poor replicate agreement Viewing replicate curves as a mean would have lead to high IC50 value being calculated

E N D
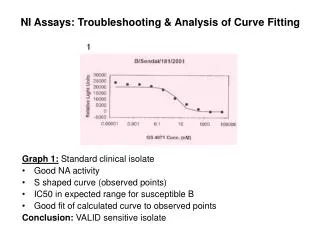
NI Assays: Troubleshooting & Analysis of Point-to-Point IC50 determination 1 Graph 1:Standard clinical isolate – Technical Error • Dark blue = first test. Pale blue = repeat test • Poor replicate agreement • Viewing replicate curves as a mean would have lead to high IC50 value being calculated Conclusion: If replicates are performed, they must be viewed individually
NI Assays: Troubleshooting & Analysis of Point-to-Point IC50 determination 2 Graph 2:Standard clinical isolate – Technical Error (2) • Dark blue = first test. Pale blue = repeat test • Replicates agree fully • Increasing NA activity with increasing drug concentration (implausible) • High IC50 Conclusion: Technical error which would lead incorrectly to high IC50 → REPEAT
NI Assays: Troubleshooting & Analysis of Point-to-Point IC50 determination Graph 3:Dispensing error • Failure to calculate correct IC50 Conclusion: Probably isolates with normal IC50 → REPEAT 3
NI Assays: Troubleshooting & Analysis of Point-to-Point IC50 determination Graph 4:Drug Titration Error • Curves begin normally • normal IC50 would be calculated • S shape is not completed Conclusion: Probably normal isolates → REPEAT to check 4
NI Assays: Troubleshooting & Analysis of Point-to-Point IC50 determination 5 Graph 5:Clinical isolate with High IC50 • Good NA activity • Good reproducibility of curve shape on repeat • Curve does not fit shape of any other circulating strain • High IC50 Conclusion: Probable resistant isolate → confirm by sequencing
NI Assays: Troubleshooting & Analysis of Point-to-Point IC50 determination 6 Graph 6:Clinical isolate with high IC50 • Reported as H3 (typical IC50 0.2-0.8nM) • Good NA activity • Shifted curve compared with subtype matched reference wild type • High IC50 • Curve shape match with alternate subtype (Flu B IC50 range 20-40nM) Conclusion: Probable incorrect subtype reporting/mixed virus (H3 and FluB) → Retype by PCR
NI Assays: Troubleshooting & Analysis of Point-to-Point IC50 determination 7 Graph 7:Classical Resistant Curves (1) • No change in NA activity compared with wild type • Shift in sigmoidal curve to left • Yellow and Pink lines show low titre viruses therefore low NA activity, but still fit the pattern of wild type and resistant
NI Assays: Troubleshooting & Analysis of Point-to-Point IC50 determination 8 Graph 8:Classical resistant curves (2) • Low NA activity compared with wild type • Flattened curves showing limited dose response • 292K mutant almost beyond range of assay at these drug concentrations