Download
1 / 78
780 likes | 1.06k Views
Manure Handling and Storage Effects on Nitrogen Losses of Dairy Farms.

E N D
1. Manure Handling and Storage Effects on Nitrogen Losses of Dairy Farms Vinicius R. Moreira
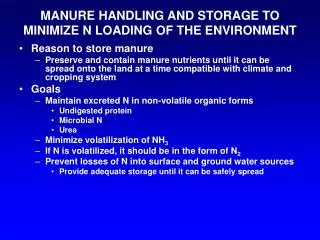
3. Introduction Enhanced Integrated Nutrient Management on Dairy Farms
4. Why has nitrogen management become an issue?
5. Jim Galloway�s N cascade
7. Effects of excessive ammonia in the atmosphere Effects to human and animal health:
ISU Extension publication #: Pm-1518k
8. Effects of excessive ammonia in the atmosphere Effects to human and animal health:
Reacts with sulfur dioxide (SO2) and nitrogen oxides (NxO) ? Aerosols.
* Clean Air Act enforces PM10;
Odor problems.
9. Effects of excessive ammonia in the atmosphere Effects on environment:
50% of NH3 is deposited within a 50-km (31 miles) range;
Farther deposition is halved every 400 km (250 miles).
Reduces visibility (haze);
Reduction of biodiversity: affect natural ecosystems through N enrichment and allow shift from native oligotrophic plant communities to competitive grass species;
Acid rain;
Eutrophication (nitrate): Gulf of Mexico Hypoxia Zone (Burkart and James, 1999).
10. Where does ammonia come from in dairy farms?
12. Factors affecting N efficiency in a dairy cow: N efficiency (kg milk N / kg feed N)
Maximum theoretical: = ~.44 (NRC, 2001);
56 experiments: .26 (range: .17-.39);
Grazing N fertilized pastures: .16 (Vuuren and Meijs, 1987).
* Reducing dietary N ? increase efficiency (and risk?).
13.
* Excreted N = urinary N + fecal N Factors affecting N efficiency in a dairy cow:
14. N distribution in dairy manure Fecal N:
Undigested feed;
Microbial proteins;
Metabolic losses.
15. Urea breakdown CO(NH2)2 + H2O 2NH3 + CO2
* Complete within 2-6h at T > 10oC (50oF - Muck, 1982, Elzing & Monteny, 1997)
16. Processes involved in ammonia volatilization from dairy manure NH3/NH4+ reaction tends to NH3 with increase in:
Temperature (Muck and Steenhuis, 1981, Muck, 1982);
pH (Muck and Steenhuis, 1981, Muck, 1982);
NH4+ concentration (Hashimoto, 1972);
Wind speed (Monteny and Erisman, 1998).
May reduce volatilization:
Floating layers (Voorburg and Kroodsma, 1992).
17. Modeling N Split Between Urine and Feces Introduction:
Objective:
To develop a regression to predict N split between urine and feces based on simple information.
Literature review:
56 experiments, 231 different treatments, 3751 cows.
Literature up to 11 years old (1990-2001).
18. Modeling N Split Between Urine and Feces Information obtained:
19. Calculations Modeling N Split Between Urine and Feces
20. Modeling N Split Between Urine and Feces Experimental and dietary information
* Estimated based on book values of dietary ingredients.
21. Modeling N Split Between Urine and Feces Production and excretion information
22. Modeling N Split Between Urine and Feces Estimating fecal N:
23. What techniques can be used to estimate N losses?
24. Methods for estimating nitrogen losses Direct measurements:
Continuous measurement:
Non Dispersive Infra Red (NDIR);
Open-Path Fourier Transform Infrared (OP-FTIR);
Optical absorption techniques
Fluorescence methods;
Gas chromatography;
Electrochemical cells;
NO monitor in combination with a high temperature catalyst stainless steel (chemiluminescence detectors);
Continuous flow denuder.
25. Direct measurements:
Discontinuous measurement:
Acid scrubbers;
Gas detection tubes;
Passive diffusion devices;
Denuders. Methods for estimating nitrogen losses
26. Methods for estimating nitrogen losses Indirect estimations:
Mass balances (N Inputs minus N outputs � van der Meer, 2001);
N:ash (Muck and Richards, 1983, Muck et al, 1984);
N:P.
27. Sources of ammonia volatilization
28. Opportunities for losses Cattle housing system
Floor barn
Tie-stall;
Free-stall:
Slatted floor;
Solid floor;
29. Validation Protocol Moreira, V.R., Santos, H.H.B., Satter, L.D.
Introduction
Objectives
To evaluate the use of N to P ratio for estimating N disappearance from manure;
To determine N disappearance from tie-stall and free-stall.
30. Validation Protocol Materials and methods
31. Validation Protocol Materials and Methods
32. Validation Protocol Results
Manure temperature (oC) and pH:
33. Validation Protocol Results
TN and TP:
34. Validation Protocol
35. Validation Protocol
36. Freeze Drying TN Protocol Introduction
Objective
To evaluate the freeze drying process on the recovery of manurial total nitrogen.
Materials and Methods
2x2x3 factorial design:
With or without acidification (2mL 67%H2SO4/90mL manure);
Three levels of ammonium sulfate (0, 3 or 6g/~90mL manure);
Analyzed fresh or after lyophilization
5 replications/treatment.
37. TN Protocol Results
38. TN Protocol
39. On-Farm Estimations Introduction
Objective
To estimate N disappearance from dairy manure from excretion until storage is emptied using P as a marker (N to P ratio).
40. On-Farm Estimations Materials and methods
13 farms were selected;
Samples collected:
Manure samples: collected throughout emptying of storage facility;
Feed samples;
Sampling period: March 27th through May 29th 2001
41. On-Farm Estimations Materials and methods
Information:
Housing (type and management);
Milk records and diet composition (N and P);
Manure storage (type and management);
Hauling schedule.
42. On-Farm Estimations Materials and methods
Sample processing was similar to that of Validation Protocol;
TN analyses were done in half of the sub-samples that were lyophilized.
43. On-Farm Estimations Results
44. On-Farm Estimations Limitations
45. On-Farm Estimations
46. Datasets Introduction
Objective
Estimate N disappearance from dairy manure based on N to P ratio, according to analyses done in commercial laboratories.
47. Datasets Materials and Methods
230 dairy manure analyses from three commercial laboratories located in Pennsylvania, Ohio and Wisconsin;
Analyses: Total Nitrogen and Total Phosphorus.
48. Datasets Results
Effect of manure storage structure on Total Nitrogen (TN), Total Phosphorus (P) and N to P ratio (N/P) (3 Labs: Pennsylvania, Ohio and Wisconsin)
1 BP = bedded pack (n=19).
2 DH = daily haul (n=68).
3 EB = earthen basins (n=136).
4 S = stack (n=7).
49. Datasets Results
Effect of season1 on Total Nitrogen (TN), Total Phosphorus (P) and N to P ratio (N/P) of 130 dairy manure analyses (2 labs: Minnesota and Wisconsin), regardless waste storage structure.
1 Seasons were arranged based on the dates of manure analyses.
2 n=15
3 n=25
4 n=36
5 n=54
50. SUMMARY
51. N Excretion
52. Housing
and
Storage
64. Validation Protocol Overall status:
Limitations:
Assumed equal proportions of urine and feces for front and back free-stall;
Day to day variation in excretion rates, mainly for tie-stall sampling;
Perspective:
Correct urine:feces excretion ratio, according to DM or P, for free-stall sampling mix all???
Tie-stall: repeated protocol in Summer for two days.
65. In Stall Scraping Introduction
Objective
To evaluate the effect of scraping frequency on N disappearance, as estimated by N to P ratio.
Materials and Methods
Scrapers were set up for 2 or 6-times a day;
Cross-over design, two sides of free stall;
Sampling protocol followed that presented for Validation Protocol.
67. Datasets Results
Effect of type of bedding on Total Nitrogen (TN), Total Phosphorus (P) and N to P ratio (N/P) of 130 dairy manure analyses (2 Labs: Minnesota and Wisconsin), regardless of storage type.
1 Manure samples with accompanying information indicating that sand or no bedding was used. This also included samples where there was no information about bedding (n=56).
2 Manure samples with accompanying information indicating that straw, hay, grass, sawdust, shaving or oat hulls (n=74).
68. Datasets Results
Effect of wall profile of manure storage on Total Nitrogen (TN), Total Phosphorus (P) and N to P ratio (N/P) of 99 dairy manure samples (3 labs: Pennsylvania, Ohio and Wisconsin).
1 n=86
2 n=13
69. Datasets Results
Effect of loading (bottom or top) of manure into the storage on Total Nitrogen (TN), Total Phosphorus (P) and N to P ratio (N/P) of 63 dairy manure samples (1 lab: Pennsylvania).
1 n=21
2 n=42
70. Datasets Results
Effect of covering the manure storage on Total Nitrogen (TN), Total Phosphorus (P) and N to P ratio (N/P) of 36 dairy manure (1 lab: Pennsylvania).
1 n=11
2 n=25
71. Procedures
Freeze Drying TN Protocol
Sampling Protocol