0 likes | 8 Views
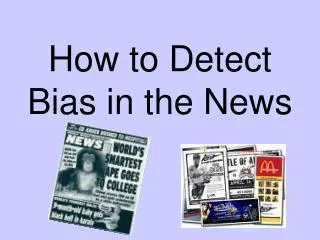
Learn how to prevent bias with practical tips for economics students. Get Data Analysis Assignment Help to detect and resolve biases for accurate analysis.<br>
E N D
Economicshelpdesk.com Exploring Bias in Data Analysis How to Detect and Prevent It Economics Help Desk Data Analysis Assignment Help Experts
Introduction: Data Bias For any student pursuing economics and working on econometrics tasks where data integrity significantly impacts validity of research, needs to be aware of how to handle data bias. Bias in data can distort outcomes resulting into incorrect conclusion and poor decision making due to flawed insights. This ppt explores various biases that exists in data. To economics students who practice data analysis through statistical software such as R, SAS, SPSS, and STATA understanding bias detection and its avoidance is crucial. Economicshelpdesk.com
What is Bias in Data Analysis Bias implies systematic errors that are caused during the process of data collection, analysis, interpretation, or any other data analysis process producing skewed results. In an academic or professional context, there are many sources that can cause bias such as sampling techniques, measurement errors, data collection and analysis, or even preconceived notions of the researcher. The presence of bias not only compromises the validity of research study but can lead to false conclusions across broader interpretations, especially in the assessment of government policies, predicting trends or market behavior.
Sources of Bias in a Data Analysis 1. Selection Bias: This arises when the sample that is used in the whole study does not represent the whole population. Similarly in economics if the survey results only include figures collected from urban areas without the rural sector, then it could be very difficult to extrapolate the results to the rest of the general population. 2. Confirmation Bias occurs when the researcher has a preconceived notion and searches for data or results that support his hypotheses irrespective of other data that may refute the hypothesis. In econometrics, selective modeling or overfitting can result from such an approach. 3. Measurement Bias: This bias can be attributed to one of two factors: inaccuracy in measurement of the data or error in data entry. For instance, improperly coded categories or the use of inconsistent units within datasets are sources of errors.
Sources of Bias (contd.) 4. Survivorship Bias: It is common in financial and economic data, and arises when only the viable projects or firms (for example, companies that survived an economic crisis) are considered, without considering the unsuccessful ones, thus skewing the final result. 5. Reporting Bias: This occurs when results are reported on the basis of what seems more publishable or attractive. For instance, when presenting data showing positive economic impact one can overshadow the information that depicts neutral or negative data. Economicshelpdesk.com
Bias detection in data analysis 1. Exploratory Data Analysis (EDA): Initial steps to detect bias can be done using EDA. Tools like R’s summary() function, SPSS’s descriptive statistics, and STATA’s summarize command help provide a snapshot of your data. For instance, abnormally high mean may be attributed to the presence of an outlier, or skewed sampling technique. 3. Checking for Overfitting or Confirmation Bias in Models: Confirmation bias turns up in econometric models where certain variables are chosen to prove the hypothesis. One way of reducing overfitting is by the use of methods such as cross-validation in R or SAS. For instance, the train() function in the caret package in R enables users to divide data into training and testing sets. This helps to check and compare the performance of the models on the test data to assess the efficiency of the prediction. 2. Correlation and Causation Checks: When studying relationships, the formal distinction between a correlation and a cause and effect must be known. In STATA the corr command yields correlation matrices while in R the cor() function can shed light on a possible spurious relationship.
Bias detection in data analysis(Contd.) 4. Random Sampling and Cross- Sampling: Choosing a random sample helps to resolve the problem of selection bias. In R, one sample() function can help to generate a random sampling of data. In SPSS, similar randomization is accomplished through the “Select Cases” tool. Cross-sampling also allows you to check whether various samples give similar outcomes in a way that supports the assertion that your data appropriately represents the population. 5. Using Weighting Function: In some cases, certain group may be represented in data more than or less than others. Weights are applied using the pweight function in STATA or the “Weight Cases” in SPSS in order to make the data more representative of the population. 6. Statistical Tests for Bias Detection: There are several statistical tests necessary in econometrics, including the independence Chi-square tests, T-Tests, as well ANOVA. For example, when comparing incomes by regions, these tests within SAS’s PROC TTEST or PROC ANOVA can prove whether a significant difference exists in the groups to argue for sampling or reporting distortions.
What Can You Do to Minimize Bias? 1. Thoroughly Clean Data 2. Utilize Stratified Sampling 3. Apply Blinding Techniques Cleaning is essential for preventing measurement bias. R’s dplyr and tidyverse libraries offer flexible data cleaning functions, allowing students to filter, rename, and standardize data columns. In SPSS, the “Recode into Different Variables” tool helps standardize data without overwriting original values, reducing the risk of measurement inconsistencies. For economically diversified places, make sure that each sub- group (urban, rural, and the rest) is well represented. In SAS, PROC SURVEYSELECT enables one to carry out stratified random samples which is also possible in STATA using the option; strata. Minimize the confirmation bias by blinding some of the data that might create biases. For instance, while performing hypothesis testing, sometimes it is useful to ‘blind’ some of the variables so as not to influence the outcome. Blinding can be simulated in R by splitting and withholding specific variables during initial analyses. Economicshelpdesk.com
How to Minimize Bias? 4. Replication & Cross-Validation 5. Bias Adjustment through Post-Estimation In econometrics, model replication across datasets helps validate results. Generally, methods such as cross- validation in caret package in R or cv command STATA establish the reliability of the outcome confirming that the results do not emanate from biases. When certain biases become unavaoidable, post- estimation methods such as regression adjustment or matching really helps. For example, in STATA, the teffects command used will work on creating matched pairs for the treatment and control groups to correct selection bias. Economicshelpdesk.com
Practical Example: Detecting and Preventing Bias in R Let’s, for example, have a dataset about the influence of education on income in various regions. Here’s how bias detection and prevention might look in R # Load necessary libraries library(dplyr) # Sample Data data <- data.frame(region = sample(c("Urban", "Rural"), 1000, replace = TRUE), education_level = sample(c("High School", "Bachelor", "Master"), 1000, replace = TRUE), income = rnorm(1000, mean = 50000, sd = 10000)) # Checking for Selection Bias summary(data) # Creating stratified sample sample_data <- data %>% group_by(region) %>% sample_n(size = 100) # Stratified sampling by region This is a very basic approach to detect selection bias where data distribution needs to be checked, followed by stratified sampling and correlation analysis for confirmation bias. # Exploring correlations and potential confirmation bias cor(data$income, as.numeric(as.factor(data$education_level)))
Data Analysis Assignment Help Precision Support for Students Our Data Analysis Assignment Help service is designed for students who need expert guidance to complete assignments with high accuracy and understanding. We assist students in statistics, econometrics, and data science coursework, offering support in software such as R, SAS, SPSS, and STATA. Our service includes comprehensive solutions that explain the methodology, interpretations of findings, graphs, tables, and annotated code. Each solution is crafted to provide a deep understanding, ensuring that students don’t just get the correct answer but also grasp the underlying concepts. We emphasize clarity, using clear explanations and detailed outputs that make complex topics accessible. Students can avail themselves of this service by simply reaching out with their assignment requirements. Our experienced data analysts work closely with students, ensuring that solutions are customized to their needs. With a focus on econometrics and applied statistics, our assistance provides an invaluable resource for students aiming to excel in data analysis. Opting for our service offers students the opportunity to learn from professionals while receiving precise, high-quality results.
Recommended Textbooks for Further Learning "Principles of Econometrics" by R. Carter Hill, William E. Griffiths, and Guay C. Lim "Data Analysis Using Regression and Multilevel/Hierarchical Models" by Andrew Gelman and Jennifer Hill 3. Johnson, Richard A., and Dean W. Wichern. “Applied Multivariate Statistical Analysis.”
Economicshelpdesk.com THANK YOU email: info@economicshelpdesk.com whatsapp: +44-166-626-0813 Economics Help Desk Data Analysis Assignment Help Experts