1 likes | 1 Views
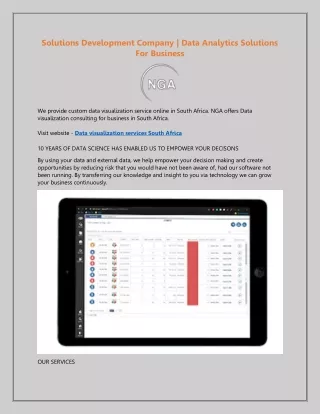
Discover how professional presentation design services transform complex data into clear, engaging visuals. EZ helps businesses tell powerful stories through modern data visualization trends.
E N D
Data Visualization Trends: How Professional Presentation Design Services Make Complex Information Simple We live in an age where attention spans are shrinking, and decision-makers are constantly bombarded with information. In such an environment, clarity is power. Presentations have become the go-to tool for pitching ideas, communicating insights, and persuading stakeholders. But here’s the challenge: how do you turn pages of numbers, charts, and text-heavy slides into a story that captivates and convinces?
The answer lies in professional presentation design services. By combining visual storytelling with modern data visualization trends, these services transform complex information into clear, compelling narratives. Let’s explore why businesses today are relying on presentation design agencies to simplify complexity and how EZ stands out in this evolving landscape. What Are the Most Effective Ways to Present Data in Presentations? Presenting data isn’t just about placing charts on slides. It’s about ensuring your audience sees patterns, grasps insights, and remembers the message long after the meeting. Some of the most effective approaches include: 1.Storytelling with Data: Instead of bombarding audiences with numbers, structure data into a beginning, middle, and end. Frame it as a problem, the supporting evidence, and the solution. 2.Minimalism in Design: Less is more. Cluttered slides dilute impact. Professional designers use whitespace, consistent colors, and clean typography to keep focus on what matters. 3.Contextual Visuals: Data on its own is meaningless without context. Adding comparisons, benchmarks, or historical perspectives helps audiences interpret numbers effectively. 4.Interactive Elements: In modern corporate presentations, interactivity — clickable charts, animations, or dynamic infographics — keeps audiences engaged and curious. Professional presentation design services combine these methods seamlessly, ensuring your slides communicate not just data, but meaning.
How Can I Make Statistical Information More Engaging in Presentations? Statistical information often feels overwhelming. Rows of percentages or raw figures can quickly lose an audience’s interest. The key is to translate numbers into narratives and visuals that resonate. ●Use Visual Analogies:For instance, instead of stating “30% market share,” show three highlighted blocks out of ten. ●Highlight Key Numbers: Use bold colors or large fonts for the most important statistics to guide attention. ●Incorporate Motion Graphics: Subtle animations can show data progression, making trends more intuitive. ●Balance Text and Graphics: Pair a simple sentence with a strong graphic. This prevents data from feeling heavy. This is where a presentation design agency truly adds value. By understanding both design principles and business objectives, they ensure data is not just presented but remembered.
Which Data Visualization Formats Drive the Most Audience Understanding? Choosing the right format is half the battle. Different datasets call for different visual treatments, and using the wrong one can confuse rather than clarify. The most effective formats include: ●Bar & Column Charts: Perfect for comparing categories or tracking growth over time. ●Line Graphs: Best for showing trends, progressions, and projections. ●Pie & Donut Charts: Useful for showing proportions but should be used sparingly. ●Heat Maps: Ideal for highlighting areas of intensity or frequency in large datasets. ●Infographics: Combine text, visuals, and icons for an engaging, easy-to-digest presentation of complex ideas. Modern presentation design services go beyond basic charts, experimenting with data storytelling formats that are interactive, colorful, and customized to industry contexts.
The Rise of Professional Presentation Design Services – Gone are the days when a PowerPoint template was enough. Today, high-stakes pitches, investor decks, and boardroom presentations require finesse and creativity. Professional design isn’t a luxury anymore —it’s a necessity. Here’s why: ●Visual Consistency: A professionally designed deck ensures brand colors, fonts, and tone are consistent. ●Audience-Centric Messaging: Designers know how to highlight what matters most to your audience. ●Time Efficiency: Instead of spending hours adjusting layouts, businesses can focus on strategy while experts handle design. ●Higher Impact: Well-designed presentations not only convey data but also enhance credibility and authority. That’s why businesses today increasingly rely on the best presentation design companiesto give them a competitive edge. Why Businesses Choose a Presentation Design Agency – A presentation design agencydoes more than make slides “look good.” It’s about aligning business goals with design thinking. Agencies bring together teams of visual storytellers, data specialists, and creative strategists who understand: ●How to adapt designs for different formats (boardroom, webinar, investor pitch, or sales demo). ●How to incorporate brand identity without overwhelming the audience. ●How to design for both clarity and persuasion. This expertise ensures businesses not only communicate information but also inspire action.
EZ: Your Partner in Powerful Presentations – At EZ, we understand that behind every presentation is a story waiting to be told. Our presentation design services are built to transform complex data into visuals that are clear, compelling, and customized to your needs. Here’s how EZmakes the difference: ●Creative Storytelling: Every slide is designed to guide audiences on a journey. ●Cutting-Edge Visualization: We use modern trends and formats to make statistics engaging. ●Tailored Approach:Whether it’s an investor pitch, quarterly report, or training module, we adapt design to context. ●Global Expertise: As one of the best presentation design companies, we combine international design practices with local insights. ●Collaborative Process: Our team works closely with clients to ensure each presentation reflects their brand voice and goals. From start-ups raising their first round of funding to global enterprises presenting to international boards, EZ has empowered businesses with presentations that not only inform but also inspire. Final Thoughts – Complex information doesn’t have to overwhelm. With the right design approach, data can tell stories that are both persuasive and memorable. Professional presentation design services are no longer optional —they’re essential for businesses that want to communicate with clarity and confidence. Whether you’re looking to simplify dense statistics, create visually stunning slides, or design presentations that close deals, the key is to partner with a team that understands the art and science of storytelling. At EZ, we bring data to life. Let our expertise as a leading presentation design agency help you make every presentation your most powerful tool for influence. Because when complexity becomes simplicity, audiences don’t just listen — they act.