DATA MODELS
E N D
Presentation Transcript
Overview: One of the most important topic in GIS(Geographic information system), which is types of data. In this presentation, we will introduce types of Geographic data in order to define them and differentiate between them. Their characteristics and the usage of each one. Their definition and how they is stored and used in geographic database, also their format.
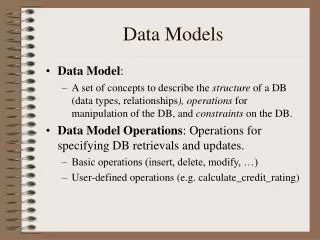
What is data modeling? As well as, we know the importance of data and how the representation of data should be understood in order achieve better results. The definition from GIS perspective, will be divided into three sections: • Data model: In information theory, a description of the rules by which data is defined, organized, queried, and updated within an information system (usually a database management system). In ArcGIS, a set of database design specifications for objects in a GIS application. A data model describes the thematic layers used in the application (for example, hamburger stands, roads, and counties); their spatial representation (for example, point, line, or polygon); their attributes; their integrity rules and relationships (for example, counties must nest within states); their cartographic portrayal; and their metadata requirements.
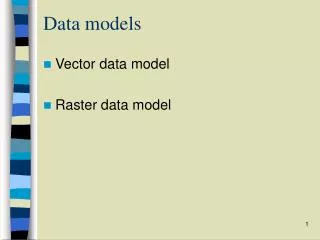
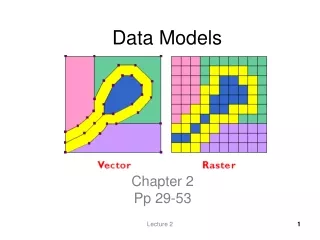
What is data modeling? – Cont. • Vector data model: A representation of the world using points, lines, and polygons. Vector models are useful for storing data that has discrete boundaries, such as country borders, land parcels, and streets.
What is data modeling? – Cont. • Raster data model A representation of the world as a surface divided into a regular grid of cells. Raster models are useful for storing data that varies continuously, as in an aerial photograph, a satellite image, a surface of chemical concentrations, or an elevation surface
Data Format: Vector Data Formats • Shape-file: • A shape-file stores non-topological geometry and attribute information for the spatial features in a data set. The geometry for a feature is stored as a shape comprising a set of vector coordinates. • Because shape-files do not have the processing overhead of a topological data structure, they have advantages over other data sources such as faster drawing speed and edit ability. Shape-files handle single features that overlap or that are noncontiguous. They also typically require less disk space and are easier to read and write. • Shape-files can support point, line, and area features. Area features are represented as closed loop, double-digitized polygons. Attributes are held in a dBASE® format file. Each attribute record has a one-to-one relationship with the associated shape record.
Data Format-Cont. • Coverage: • A coverage is a geo-relational data model that stores vector data—it contains both the spatial (location) and attribute (descriptive) data for geographic features. Coverages use a set of feature classes to represent geographic features. Each feature class stores a set of points, lines (arcs), polygons, or annotation (text). Coverages can have topology, which determines the relationships between features. • A coverage is stored as a directory within which each feature class is stored as a set of files. For example, a coverage appears in ArcCatalog with the icons as shown below. In this example, you can see that the streams coverage is a line coverage containing an arc (line) file, annotation for the line, and a tic file. There are also two versions of coverage files.
Data Format-Cont. • GeoDatabase: Geodatabaseshave a comprehensive information model for representing and managing geographic information. This comprehensive information model is implemented as a series of tables holding feature classes, raster datasets, and attributes. In addition, advanced GIS data objects add GIS behavior; rules for managing spatial integrity; and tools for working with numerous spatial relationships of the core features, raster, and attributes.
Data Format-Cont. • CAD files: AutoCAD and MicroStation each use a proprietary file-based vector format. Both formats are capable of supporting 2D and 3D information.
Data Format-Cont. Raster Data Formats: • Grids • Grids are an ESRI file format used to store both discrete features such as buildings, roads, and parcels, and continuous phenomena such as elevation, temperature, and precipitation. • Recall that the basic unit of the raster data model is the cell. Cells store information about what things are like at a particular location on the earth's surface. Depending on the type of data being stored, cell values can be either integers (whole numbers) or floating points (numbers with decimals). There are two types of grids: one stores integers and the other stores floating points. • A discrete grid contains cells whose values are integers, often code numbers for a particular category. Cells can have the same value in a discrete grid. For example, in a discrete grid of land use, each land use type is coded by a different integer, but many cells may have the same code. Discrete grids have an attribute table that stores the cell values and their associated attributes. • A continuous grid is used to represent continuous phenomena; its cell values are floating points. Each cell in a continuous grid can have a different floating point value. For example, in a continuous grid representing elevation, one cell might store an elevation value of 564.3 meters, while the cell to the left might store an elevation value of 565.1 meters. Unlike discrete grids, continuous grids don't have an attribute table.
Data Format-Cont. • Images • The term "image" is a collective term for rasters whose cells, or pixels, store brightness values of reflected visible light or other types of electromagnetic radiation, such as emitted heat (infrared) or ultraviolet (UV). Aerial photos, satellite images, and scanned paper maps are examples of images commonly used in a GIS. • Images can be displayed as layers in a map or they can be used as attributes for vector features. For example, a real estate company might include photos of available houses as an attribute of a homes layer. To be displayed as a layer, however, images must be referenced to real-world locations. • For example, an aerial photo as it comes from the camera is just a static picture, like a picture of a house. There's no information about what part of the world the photo has captured, and the photo may contain distortion and scale variations caused by the angle of the camera. To display properly with other map layers, the aerial photo must be assigned a coordinate system and some of its pixels must be linked to known geographic coordinates.
Data Format-Cont. Now, we can make conclusion according to data type as mentioned through the presentation, we all knew that and image is a set of pixels with columns and rows defined by RGB, as shown at right hand side in figure 1.0, or could be satellite imagery, while the vector data is presented either by point, line or polygon. Figure 1.0
Sources of data: • As well as all we know that gathering data is important, the data should be meaningful, accurate, to the point, so when collecting real time GIS data, or to store data, should be from trusted resources. • Where to get data? • From internet. • GeoServer. • Remote Sensing. • Scanned photos. • Digital orthophotos. • Collector for ArcGIS. • Point data samples from surveys. • List of GIS data sources.
ADVANTAGES & DISADVANTAGES: • Vector Data • Advantages: • Good representation of reality • More efficient data storage • Topology can be described in a network • Accurate graphics • Disadvantages : • Complex data structures. • Simulation may be difficult. • Some spatial analysis operations are difficult or impossible to perform.
Raster Data ADVANTAGES & DISADVANTAGES - Cont.: • Advantages: • Simple data structure. • Easy overlay. • Various kinds of spatial analysis. • Uniform size and shape. • Cheaper technology. • Disadvantages : • Large amount of data. • Less “pretty”. • Projection transformation is difficult. • Different scales between layers can be a nightmare. • May lose information due to generalization.