Download
1 / 78
800 likes | 1.3k Views
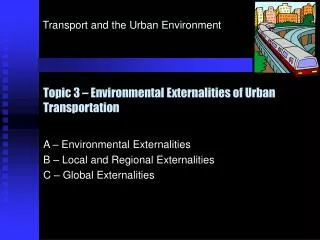
Topic 3 – Environmental Externalities of Urban Transportation A – Environmental Externalities B – Local and Regional Externalities C – Global Externalities Environmental Externalities A 1. Concept 2. Distribution of Costs 3. Types of Emissions 4. Emission Models Concept A-1

E N D
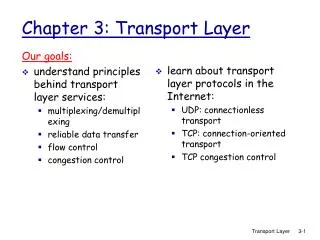
Topic 3 – Environmental Externalities of Urban Transportation A – Environmental Externalities B – Local and Regional Externalities C – Global Externalities
Environmental Externalities A • 1. Concept • 2. Distribution of Costs • 3. Types of Emissions • 4. Emission Models
Concept A-1 • A paradox... • Demands on urban transportation have increased substantially. • Supports increasing mobility demands. • Transport function taken for granted. • Transport costs went down significantly. • … that has consequences • Transport increasingly linked to environmental problems. • Transportation accounts for 30% of all greenhouse gas emissions. • Technology mostly focused upon the internal combustion engine. • Spatial accumulation of transportation main factor behind the emission of common urban pollutants. • Urban transportation is often subsidized by the society. • Total costs, notably environmental damage, not assumed by the users.
The Paradox of Mobility and its Costs A-1 Costs Mobility • Internal costs (users) • External costs (society) • Environmental damage • Increasing demand • Internal combustion engine • Energy (petroleum)
Concept A-1 • Definition • Costs that are not assumed by the polluter; the source of pollution. • Consideration of physical measures of environmental damage. • Evaluation of involved costs for the society. • Costs of environmental externalities can be considered from economic, social and environmental dimensions. • Costs attributed to a few sources (e.g. users of cars) must be burdened by the whole society (users and nonusers alike). • Knowing the origins of environmental externalities is a relatively easy undertaking. • Evaluation of the total costs very difficult.
Environmental Externalities A-1 • Concept • The environment is a sink. • Consideration of physical measures of environmental damage. • Evaluation of involved costs for the society. • Can be considered from economic, social and environmental dimensions. Sink Lithosphere Hydrosphere Atmosphere Ecosphere
Environmental Externalities Total costs Optimal cost Externalities Intervention costs A-1 Costs Level of intervention
Estimated Automobile Costs, 1996 A-1 • Internal variable costs • Vary according to the amount of travel. • Include vehicle operation and travel time. • Internal fixed costs • Related to the vehicle ownership and parking fees. • Depreciation, insurance, finance charge, license fee, etc. • External costs • Not assumed by individual users but by the collectivity. • Include environmental damage.
Distribution of Costs A-2 • Relationships • Several relationships are not known and / or difficult to evaluate. • Quantification is only at its preliminary stage. • Many polluters used this argument to differ the application of several environmental policies by lobbying governments (e.g. acid rain and CFCs). • Bearing the consequences • The emitters of pollutants rarely bear the consequences of their impacts and costs for the society. • Users only take account of the direct costs of ownership like a car (vehicle, fuel, insurance, etc.). • Possession is often the only entry and utilization cost for several transportation modes.
Distribution of Costs A-2 • The society generally assumes costs • Providing and maintaining infrastructure. • Damage to structures and infrastructure. • Losses in productivity (agriculture and labor). • Cleanup. • Health services. • Damage to ecosystems. • Geographic separation between sources and recipients • Acid rains and greenhouse effects are obvious examples. • A community may be affected by noise levels well over its own contribution (notably near major highways). • Another (suburbs) may be affected in a very marginal way and still significantly contributes to noise elsewhere during commuting.
Distribution of Costs A-2 • Quantification • Economic, social and environmental costs. • Very difficult but possible if we accept some simplifications and generalizations. • Land transportation: • Noise related costs account for 0.1% of GDP. • Health (social) from 0.04% to 0.11% of GDP. • Damage to structures and infrastructure 0.07% and between 0.1% of GDP. • 0.16% of GDP for damage to the natural environment. • The important contribution of transportation to environmental externalities.
Types of Emissions A-3 • Cold Start • Vehicle engine has been turned off for some time and the catalytic converter (if present) is cold. • HC and CO emissions are higher when a cold engine is first started than after the vehicle is warmed up. • Catalytic emission control systems do not provide full control until they reach operating temperature. • Richer fuel air mixture must be provided to the cylinders under cold operating conditions to achieve satisfactory engine performance. • Extra fuel is added to ensure that an adequate amount of fuel is vaporized to achieve a combustible mixture. • Complete vaporization eventually occurs in the engine cylinder as a result of the high temperatures created by combustion.
Types of Emissions A-3 • Fuel cannot be completely burned due to a lack of sufficient oxygen in the cylinder. • Partially burned fuel and unburned fuel are emitted in relatively high concentrations from a cold engine. • Hot Start • Engine has been turned off for such a short time that the catalyst has not had time to cool to ambient temperature. • HC and CO hot start emissions are significantly lower than under cold start operation. • Hot Stabilized • Engine and emission control systems have reached full operating temperatures. • Generally, emissions are relatively low (compared to cold start emission rates) under hot stabilized conditions. • However, emissions are also highly dependent on vehicle speed and engine load.
Types of Emissions A-3 • Idle Emissions • Emissions when the vehicle is not moving. • Often occur during congestion. • Lower levels of emission, but still significant since the fuel burned does not provide anything useful. • Hot Soak • Occurs when a hot engine is turned off. • Fuel exposed to the engine (e.g., in carburetor float bowls or in fuel injectors) may evaporate and escape to the atmosphere. • Running Losses • Resulting from vapor generated in gasoline fuel tanks during engine operation. • Problem on vehicles that have exhaust systems in close proximity to the gasoline tank. • Vapors emitted from the tank vent exceed the rate at which they are being purged from the canister by the engine.
Types of Emissions A-3 • Resting Losses • Emissions resulting from vapors permeating parts of the evaporative emission control system. • Significant HC emissions, especially in warm areas where the fuel take has an higher vapor pressure. • Refueling Losses • Vapor space displacement and spillage. • As a fuel tank is being refueled, the incoming liquid fuel displaces gasoline vapor. • Pushing the vapor out of the tank. • Spillage simply refers to a small amount of fuel that is assumed to drip on the ground and subsequently evaporate into the ambient air.
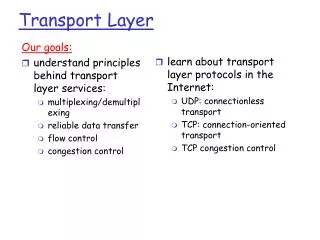
Emission Models A-4 • Purpose • Evaluate the air quality impacts of the fleet. • Indicate progresses in meeting or complying to air quality standards. • Help identify where efforts should be placed to improve environmental quality. • Track the emission impacts of: • Technology changes. • Changes in travel patterns. • Changes in vehicle sales. • MOBILE • Emission model developed by the American EPA. • Provides exhaust hydrocarbon (HC), carbon monoxide (CO), and oxides of nitrogen (NOx) emission rates (in grams/mile) for eight separate vehicle categories.
Components of the MOBILE Emission Model A-4 Fleet Characteristics Driving Characteristics Atmospheric Conditions Fuel Characteristics Emissions
Emission Models A-4 • Fleet characteristics • Weight of the vehicle and its load has a direct impact on combustion. • Aerodynamics. • Vehicle age and accumulated mileage. • Friction between its parts (gear, transmission, brakes, wheels, etc.). • Base emission rate. • A new vehicle has a set of emission rates. • As a vehicle ages, it tends to consume more fuel because its parts become less efficient. • Older vehicles tend to have higher emission levels. • Technological improvements, like catalytic converters, have significantly reduced CO, CO2, and HC emissions but have increased NOx emissions.
Emission Models A-4 • Driving characteristics • Also referred as test conditions. • Optimal speed of a vehicle ranges around 60 km per hour. • Transportation system permitting optimal travel speeds and uninterrupted flows would provide minimal combustion levels and emission factors. • Real road conditions, particularly in urban areas, do not enable optimal travel speeds. • Congestion, traffic signals and freeways have a high tendency to discriminate travel speeds. • Raise combustion and emission levels. • Majority of urban vehicle-km traveled are at speeds other than the optimal.
Emission Models A-4 • Atmospheric conditions • Influence combustion in a direct manner. • Low temperatures increase combustion, and indirectly road conditions. • During winter car engines require more energy to warm up (cold start) and keep comfortable conditions for passengers. • Snow and rain accumulation, wind and impaired visibility increase combustion. • Cooling systems for the engine and the passenger consume more energy as the ambient temperature rises. • Cold temperatures increase CO and HC emissions. • Fuel characteristics • Level of fuel volatility. • Oxygenate content. • Influence both evaporative and exhaust emission rates.
Inputs and Outputs of the MOBILE Emission Model A-4 Volatility Class HC Emissions Temperature CO Emissions Reid Vapor Pressure Region NOx Emissions Year 8 categories of vehicles Average Speed Operating Mode Outputs Inputs
Annual Emissions of Air Pollutants for a Passenger Car in the United States, 1997 A-4
Annual Emissions of Air Pollutants for a Light Truck in the United States, 1997 A-4
Local and Regional Externalities B • 1. Air Pollutants • 2. Water Pollutants • 3. Noise
Local Structure and Exposure B-1 Traffic emissions Buffer Habitat
Air Pollutants B-1 • Context • The most important source of environmental externalities for transportation. • The nature of air pollutants is clearly identified. • The scale and scope on how they influence the biosphere are subject to much controversy. • Carbon Monoxide • Colorless, odorless gas and poisonous. • Result of the incomplete combustion of hydrocarbons. • Transportation accounts from 70 to 90% of total carbon monoxide emissions. • The air pollutant the most strongly associated with transportation. • Present near major traffic intensive arterials, notably in urban areas. • When inhaled, it combines with hemoglobin to form carboxyhemoglobin.
Air Pollutants B-1 • Preventing absorption of oxygen and resulting in asphyxiation. • 0.5% of carbon monoxide in air may prove fatal in less than half an hour by transforming over 50% of the hemoglobin in carboxyhemoglobin. • Lower concentrations of carbon monoxide (3 ppm) may cause poisoning symptoms and affect people with heart, lung and circulatory system weaknesses. • Also effects the respiration of plants by inhibiting photosynthesis. • Since carbon monoxide is not chemically very stable, direct global effects are strongly limited (probably non existent). • Indirectly, carbon monoxide contributes to the formation of greenhouse gazes as a catalyst.
Air Pollutants B-1 • Nitrogen oxide (NO or NO2) • Brown, odorless gas. • A by-product of combustion when energy is used to oxide nitrogen instead of an hydrocarbon. • Transportation accounts from 45 to 50% of total emissions of nitrogen oxides. • Other sources: • Chemicals (notably nitrates) industrial production. • Combustion of fossil fuels in thermal power plants. • Nitrogen oxides are not very harmful to humans (particularly NO), but when released from an internal combustion engine, high concentrations are often toxic. • It irritates and infects the respiratory system and the eyes. • Some decreases in the ability to resist bacterial infection were observed when exposed to significant concentrations of nitrogen dioxide.
Air Pollutants B-1 • Nitrogen oxides are known to prevent the growth of crops and thus reduce agricultural yields. • Increased at a rate of 0.2% annually over the last decades. • They are a catalyst for ozone, a component of acid rain and a component of smog. • Depositions of nitrogen oxides influence the nitrate cycle, particularly in water where it influences algae blooms.
SO2 and NOx Emissions in North America and Europe, 1980-1994 B-1
Percentage Contributions of Vehicle Types to Emissions of NOx in the UK, 1997 B-1
Air Pollutants B-1 • Hydrocarbons and Volatile Organic Compounds - (HC/VOC) • Hydrocarbons (HC) are a group of chemical compound composed of carbon and hydrogen. • When in a gaseous form, HC are called Volatile Organic Compounds (VOC). • Several HC and VOC are heavy gazes or volatile compounds with a strong odor. • Mostly the result of the incomplete combustion of gasoline or by-products of the petrochemical industry. • Include methane (CH4), gasoline (C8H18) and diesel vapours, benzene (C6H6), formaldehyde (CH2O), butadiene (C4H6) and acetaldehyde (CH3CHO). • Transportation accounts from 40 to 50% of total emissions of HC/VOC.
Air Pollutants B-1 • Emitted by incomplete combustion (70%), during refueling (10%) or by evaporation from storage units (20%), particularly gas tanks. • A car parked overnight during summer emits approximately 4 grams of HC/VOC. • Other important sources are petrochemical (plastics and solvent) industries. • Impacts • All HC/VOC are carcinogen (cases of leukemia linked with benzene) to some extent. • Fatal at high concentrations. • Harmful to crops and accumulates within the food chain. • Heavy hydrocarbons (like benzene) are far more carcinogen than light hydrocarbons (like methane). • All HC/VOC have several global effects. • They are components of smog, catalysts for ozone and components of acid rain.
Air Pollutants B-1 • Particulates • Various solids in suspension such as smoke, soot, and dust. • Results of the incomplete combustion of fossil fuels, notably coal. • May also carry traces of other toxic substances like HC/VOC. • Transportation accounts for around 25% of total emissions. • Diesel engines are the main emitters. • Other important sources are thermal power plants using coal. • Particulates are carcinogen. • Harmful to lungs tissue. • Worsen respiratory and cardiovascular problems, notably if their size is smaller than 5 microns. • Particulates depositions may alter the aesthetic of structures. • The accumulation of particulates in the atmosphere and deposition on leafs may reduce photosynthesis and plant growth.
Percentage Contributions of Vehicle Types to Emissions of Particulate Matter in the UK, 1997 B-1
Air Pollutants B-1 • Smog • Mixture of solid and liquid fog and smoke particles. • Carbon monoxide. • Ozone. • HC/VOC. • Nitrogen oxides. • Sulfur oxide. • Water vapor. • Particulates, and other chemical pollutants. • Photochemical smog are those with a higher concentration of ozone and HC/VOC. • Strongly linked with transportation and industrial activities, notably in urban areas. • Particularly dense during a thermal inversion (static regional air masses that enable the accumulation of pollutants).
Air Pollutants B-1 • The effects of smog are the conjunction of those of its major components. • Deaths among susceptible persons (respiratory and cardiovascular problems) grows sharply during thermal inversions. • Several large cities (like Los Angeles, Tokyo and Mexico) have serious smog problems. • Emissions reduction policies were established. • Stricter emission controls. • Alternance of driving days. • Smog impairs visibility considerably and causes different annoyances (odors, irritations, etc.). • Because of its components, smog is highly associated with acid rains and greenhouse effects.
Air Pollutants B-1 • Lead • Toxic metal mainly used as an anti-knock agent in gasoline (Lead tetraethyl - Pb(C2H5)4) and in batteries (lead dioxide as an anode and lead as a cathode). • Until recently, lead tetraethyl was a main source of atmospheric lead emissions in developing countries. • This contribution has dropped in absolute numbers but still accounts for 30 to 40% of total emissions. • Batteries are an important source of lead for transportation, but a very limited amount of this lead is carried through the atmosphere. • Extremely poisonous metal. • Has effects on the metabolism and accumulates in living tissues. • May causes anemia and mental retardation for young children. • An extremely high occurrence of mental retardation in some parts of Mexico city was directly linked with lead poisoning. • Small doses may cause behavioral changes.
Countries Still Using Lead Gasoline, 1995 B-1 USE LEADED GASOLINE
Air Pollutants B-1 • Fixed by plants and animals and re-contaminate the food chain. • Has a high potential to accumulate in the environment. • Can be transported in the atmosphere over wide distances. • Odors • Subjective perception of the sense of smell. • Different "shapes" of odors perceived as pleasant, neutral, or unpleasant. • Long run exposition to specific odors attenuates their perception. • Diesel and gasoline engines are the major sources of odors accounted by transportation. • Odors are particularly prevalent during smog conditions. • At worst an annoyance, but they are linked with the presence of harmful air pollutants like sulfur dioxide, ozone and HC/VOC. • People tend to stay or move away from areas having a significant prevalence of odors.
Contribution of Transportation in the Emission of Major Air Pollutants in Selected Countries, 1980 (%) B-1
Water Pollutants B-2 • Air Pollution Fallouts • Occur when a pollutant goes from an airborne state (gas, solid or liquid) towards a solute or colloidal state. • Water is a very good solvent for several pollutants, notably acid depositions. • Accelerated and concentrated in an area by rainy conditions. • As an important source of air pollution, transportation accounts on a similar scale for fallouts. • In some areas transportation may account for up to 25% of nitrogen fallouts in water. • Sulfuric and nitric acids that may alter the pH of water if they are present in sufficient concentrations. • It is estimated that acid rains may account for more than 75% of the growth of acidity of lakes.
Water Pollutants B-2 • Several northeastern United States and eastern Canadian lakes have seen their entire fish population destroyed as a result of increased acidity levels. • Also includes damage to forests like reduced photosynthesis (sparse foliage) and acidified soils (limited nutrients). • Nitrous oxides may affect the ecological balance of marine life by favoring algae blooms. • Fallouts such as HC/VOC and lead are poisonous and may disrupt marine life if they accumulate in the aquatic food chain. • May increase the turbidity of water and thus reduce the photosynthesis capacity of aquatic plants. • Long term accumulation of air pollution fallouts of various nature will contaminate and disrupt whole aquatic ecosystems.
Water Pollutants B-2 • De-Icing of Infrastructure • Salt (NaCl) lowers the melting point of water. • Presents an useful compound for keeping safe road conditions in sub-zero climates. • Other elements like sand and gravel are also added to provide adherence. • Infrastructure involve roads, parking lots, airfields etc. • Almost the only artificial source of salt release in the environment. • Other compounds like calcium and magnesium can be used, but they work more slowly and cost ten times as much. • High concentrations in fresh water environments disrupt life cycles and may be fatal to some organisms like larvae.
Water Pollutants B-2 • De-icing salt has the tendency to accumulate in snow and soils beside roadways. • During early springtime, nearly all the salt accumulated will be released in the hydrographic system. • Contaminate ground water and interfere with the growth of plants and the reproduction cycle of aquatic life. • Runoffs • Substances accumulated by a surface (notably a road) are dissolved / carried by water and evacuated elsewhere. • Often the convergence of a surface to a point. • Lubricants from car leakages - engine, brakes, and transmission). • Heavy metals (Zn, Cd, Cu, Ni, Cr and Fe ) from abrasion of tires and brake linings. • Dry fallouts (HC/VOC, particulates).
Water Pollutants B-2 • Road infrastructure (parking lots, roads, drainage systems) is the major source of runoffs. • Highways occupy 5-8% of the urban catchment area. • Contribute for as much as 50% of the total suspended solids, 16% of the total HC and 75% of the total metal inputs to a receiving stream. • Will alter the turbidity and the oxygen level of water (warm water holds less oxygen), and contaminate the food chain. • May increase the eutrophication process of several lakes, particularly in recreational areas where dirt roads are dense. • Most cities have 30 to 70% of their surface occupied by roads and parking space. • They represent important sources of runoffs.
Water Pollutants B-2 • Construction and Maintenance of Infrastructure • Several transportation infrastructures have important territorial handholds. • The removal of natural habitats along shorelines is one of the most important impact. • Road transportation: • Accounts for most of the territorial handhold of transportation. • Structures like bridges and parking facilities. • Maritime transportation: • Several disruptive infrastructure like piers, canals, harbors and terminals. • Dredging accounts alone for 80% of the waste released in aquatic environments. • Influences the turbidity of water and destroys habitats.
Water Pollutants B-2 • Airports have similar effects when constructed over wetland. • Chek Lap Kok airport in Hong Kong. • The aquatic / land interface to which several animal and vegetal species depend is considerably reduced. • Roads and rails, when running through wetland, reduce the water regeneration / purification. • Splitting available areas and disrupting water flows. • Large ports occupy extensive areas along the shorelines of waterways and coasts. • Construction and maintenance of port infrastructure have extensive impacts over aquatic environments. • Construction of canals: • Xhanges whole hydrographic systems. • Altering water flows (quantity and speed) at regional and often at continental levels.
Noise B-3 • Definition • Noise (air and infrastructure vibration) is an inherent characteristic of transportation. • Noise is an undesirable sound. • Representation of noise emissions: • Point (a vehicle). • Line (a highway). • Surface (ambient noise generated by a set of streets) sources. • Measuring noise • The acoustic measure of the intensity of noise is expressed in decibel (dB). • Scale ranging from 1 db to 120 db. • 0 db is barely perceivable by human beings while 120 db is considered to be the threshold of pain.