GLOBAL WARMING
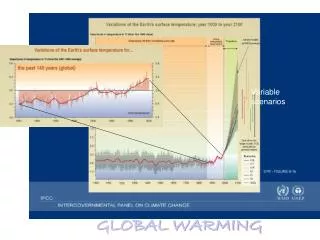
Variable scenarios GLOBAL WARMING Temperatures are rising General principles, not numbers. GLOBAL WARMING “Greenhouse Effect” Solar Energy Balance (complicated mass balance problem) Three notable points about this graph 1 2 3 How does one ‘read’ past temperatures from ice?

GLOBAL WARMING
E N D
Presentation Transcript
Variable scenarios GLOBAL WARMING
General principles, not numbers. GLOBAL WARMING “Greenhouse Effect” Solar Energy Balance (complicated mass balance problem)
Three notable points about this graph123 How does one ‘read’ past temperatures from ice?
Given that people were not measuring temperature or atmospheric CO2 400,000 years ago, how can we construct the previous graphic? Isotope formation (C, N,..) is temperature dependent. Isotopes are in equilibrium in atmosphere. Deposition captures a signal of the isotope ratio of the atmosphere This isotope ratio can be calibrated to detect a climate signal. Deposition can come from ice cores (H2O, CO2), diatoms (calcium carbonate), or other hard sediments. O18/ O16 C13/ C12
The temperature of the earth is a matter of heat balance between solar inputs and loss through the atmosphere • The earth’s temperature is determined by: • The amount of solar energy the earth receives • Sunspot activity causes fluctuations • Variations in earth’s orbit around sun • The amount of solar energy the earth reflects / refracts • A function of the planet surface and atmosphere • Retention of heat by the atmosphere • A function of natural and anthropogenic gases • Evaporation and condensation of water vapor • Climate provides feedback to modify itself
Climate varies because solar energy varies Milankovitch cycles Variation in the Earth’s orbit causes variation in solar energy absorbed and drive long term climate change
SURFACE TEMPERATURE Al Gore “AIT” point: --The 10 warmest years on record have ALL been in the last 14 years.--- Temperature deviation The trouble with temp: 1900 1920 1940 1960 1980 2000 Recently, temps are up, up, up
Where we now stand 30% 370 ppm 285 ppm
Gases vary in heat trapping abilities. Larger molecules trap more heat. Larger molecules also remain in atmosphere longer.
Other greenhouse gases are increasing as well • SOURCE: • Livestock • Draining wetlands • Warming wetlands • Industry 985 1185 1385 1585 1785 1985
What we know for certain • The concentration of heat trapping gases in the atmosphere is rising • The earth’s temperature is rising • The scale of both is consistent with human caused global warming
Global Circulation ModelsGCM’s • Models • Hadley Cell models --UK • CCC- Canadian Climate Centre models • PCM (US DOE / NCAR) , others • Idea: • Model climate on 1o grid cells, as we understand it. • Verify by predicting modern climate • Modify atmosphere (add greenhouse gases, stir) • Predict future
1. Increasing heat trapping gases, increases surface warmth The warming factors 1
2 2 1 2 3 2 3 • Ice clouds reflect more solar energy than water clouds • Particulates reflect heat rather than trap heat • High surface albedo reflects heat rather than absorb it
Add surface effects that drive climate from solar energy • Evaporation • Latent heat • Condensation • Convection currents • Air pressure differences • Coriolis effect Climate: a collection of the earth’s weather
And, you get a model… December, January February June, July, August GFHI GFHI UKHI UKHI Predicted Temperature Increase: greatest at high latitudes during the winter months
2001 Report
HADLEY MODEL PCM MODEL WINTER Summer Reduced BAU Reduced BAU
Fig. 2. Average snowpack SWE for 2020-2049 and 2070-2099 expressed as a percent of the average for the reference period 1961-1990 for the Sierra Nevada region draining into the Sacramento-San Joaquin river system Hayhoe, Katharine et al. (2004) Proc. Natl. Acad. Sci. USA 101, 12422-12427 Copyright ©2004 by the National Academy of Sciences
Model uncertainty is ‘large’ 3.5-8.5oC at equilibrium Think about this as a probability distribution with 3.5 and 8.5 equally likely, but 5.5 much more likely than either.
Uncertainties • Cause and Effect. • We have a model, but we do not have the ability to conduct a controlled experiment with the atmosphere. • Spatial variability in warming varies among models • It is very variable; predicting this variation is problematic • Consequences of warming • eg, sea level rise; health issues; agriculture, natural habitats
Primary sources of uncertainty • Aerosols in the atmosphere • Large fire events (eg, Indonesia, Mexico) • Volcanoes (eg, Mt. Pinatubo) • Air pollution • Feedbacks from natural systems • Clouds and water vapor • Ocean currents • Surface albedo, outgassing of marshes, etc • Human behavior with respect to emissions
Uncertainty, hmm? • Use a consensus-based approach. • Use UN as a platform to convene large groups of scientists to discuss and agree upon statements regarding: • Likely magnitude of greenhouse gas emissions under various future scenarios • Likely effects of those emissions on climate • Likely effects of climate change on human well-being and ecological systems
IPCC Fourth Assessment Report Synthesis Report Dr. R K Pachauri Chairman Intergovernmental Panel on Climate Change Press Presentation Saturday, 17 November 2007 Valencia, Spain INTERGOVERNMENTAL PANEL ON CLIMATE CHANGE (IPCC)
Bottom Line on Climate Projections • Most warming is at high latitudes during winter months (up to 12o C) • Global mean warming is predicted to be 1.4-5.8o C, with stabilization at 2 x CO2 (not likely to stabilize there, though) • Global mean warming of 3-8o C at equilibrium CO2 • Precipitation increases, but generally decreases over continents during the summer • Precipitation models are highly variable in space and among models. • Generally result in increased water stress
Variable scenarios Different scenarios focus on different human behaviors
CO2 concentrations Double CO2 Now