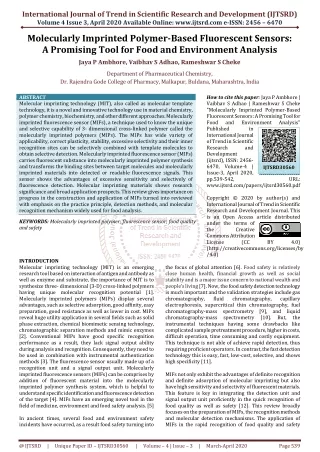
1 / 41

Molecularly imprinted polymers

Reviews on Molecularly Imprinted Polymers Based<br> Quartz Crystal Microbalance Sensors <br>

Asmamaw2
Download Presentation

Molecularly imprinted polymers

An Image/Link below is provided (as is) to download presentation Download Policy: Content on the Website is provided to you AS IS for your information and personal use and may not be sold / licensed / shared on other websites without getting consent from its author. Content is provided to you AS IS for your information and personal use only. Download presentation by click this link. While downloading, if for some reason you are not able to download a presentation, the publisher may have deleted the file from their server. During download, if you can't get a presentation, the file might be deleted by the publisher.

E N D

Presentation Transcript


  1. Molecularly Imprinted Polymers Based Quartz Crystal Microbalance Sensors By: Asmamaw Taye

  2. Outlines • Introduction • QCM Based Detection of Chemicals • Results and Discussion • Conclusion

  3. 1. Introduction 1.1. Quartz Crystal Microbalance (QCM) • Measures mass variation by measuring change in frequency. • Comprised of a thin slice of quartz single crystal with two metal electrodes deposited on both faces of the crystal. • The quartz crystal faces coated with gold is immersed in liquid electrolyte and connected to an electrochemical cell with the gold coated quartz acting as theworking electrode . Muramatsu, H.et/al. Journal of Elect. Anal. Chem, 1992, 322 (1-2), 311–323

  4. Figure 1. working principle of QCM

  5. According toSauerbreyequation: • ∆f is the measured frequency shift • fo is the resonant frequency ofthe quartzcrystal • ∆m isthe mass change • A is the piezoelectricallyactive area • 𝜌Q= 2.648 gcm-3 isthequartzdensityand • µQ= 2.947 x 10¹¹dyncm-2 isthe shear modulus ofAT-cut quartz. • The deposit is uniform while the sensitivity of the QCM is non uniform. Hillier, A. C.; & Ward, M. D. Anal. Chem, 1992, 64(21), 2539–2554.

  6. 1.2. Molecularly imprinted polymers (MIPs) • MIPs are synthetic receptors for a targeted molecule. • The interest in MIPs arises from their potential to recognize selected molecules. • The presence of the targeted molecule effects a calibrated quantity of the target. • The choice of functional monomers, cross-linkers, initiators and porogen agents and method of polymerization affects MIPs BelBruno, J. J. Chemical Reviews, 2018

  7. 1.3. Manufacturing process of MIPs 1. Formation of the template-monomer complex: • The template molecules are similar to the target molecules. • The template-monomer complex is due to coulombic interactions, π-π stacking, hydrophobic , weak hydrogen bonding and van der Waals forces. 2. Polymerization: • Addition of cross linking monomer in the template monomer complex. • Carried out in order to “lock” the template within porous, polymeric materials. • The complex is polymerized through thermal or photo initiation.

  8. 3. Extraction of the template: • Breaking the bond between the polymer and template by removing the template from the polymer structure. 4. Rebinding of the template: • The template rebinds the polymer using the empty imprinted site. • Applied for generation of the signal in QCM measurement. Ana Filipa Fernandes, L. ; master Thesis , 2015

  9. Figure 1.2. The basic principle of molecular imprinting. Emir Diltemiz, S.et/al, Sensors, 2017, 17(3), 454.

  10. Applications of MIPs • Chemical separation, Molecular sensing, Selective extraction , catalysis Advantages • High selectivity for the target molecule. • Have higher physical robustness and strength • Resistance to elevated temperature and pressure • Inertness towards acids, bases, metal ions and organic solvents. • Less expensive to be synthesized • High storage life • Permits the kinetic examination of processes that involve events at the monolayer level and thin films. Vasapollo, G.et/al. Inter. Jour. Molecu. Sci, 2011, 12(9), 5908–5945.

  11. 2. QCM Based Detection of Chemicals • QCM based multianalyte detection system, composed of six chips sensor module coated with synthetic polypeptides together with conducting polymers, was developed for the detection of acetic acid, butyric acid, ammonia, dimethyl amine, benzene, chlorobenzene, and their mixtures. • QCM based immunosensor was developed for the detection of shrimp pathogenic bacteria, Vibrio harveyi, by the covalent binding of monoclonal antibody against V. harveyi onto the Au electrode of 5 MHz. Vashist, S. K.; & Vashist, P. Journal of Sensors, 2011, 2011, 1–13

  12. Electropolymerization of benzene dissolved in the ionic liquid 1-hexyl-3-methylimidazolium tris (pentafluoroethyl) trifluorophosphate was studied at room temperature applying the EQCM technique. • EQCM based label-free immune sensor has been developed for the quantitative detection of aflatoxin B1 in groundnut. • QCM based sensor was constructed by cross-linking melanin onto the QCM gold electrode that showed high sensitivity and selectivity to a broad spectrum of metal ions.  • Schneider, O. et/al. Journal of Phy.Chem B, 2005, 109(15), 7159–7168. • Chauhan, R.et/al. Food Control, 2015, 52, 60–70 • Sadowska, M.et/al. Electrochimica Acta, 2021,368, 137599

  13. QCM and a micro charge coupled device camera was used to monitor the anticancer effects of cisplatin and 5- fluorouracil (5-FU) on human hepatoma cell line (HepG2). • MIP QCM sensor for Ractopamine detection was developed by electrodepositing a poly-o-aminothiophenol membrane on Au electrode surface modified by self-assembled Au nanoparticle (AuNPs). • The modified electrode sensor was successfully applied to determine RAC residues in spiked swine feed samples with satisfactory recoveries ranging from 87.7 to 95.2%. Kong, L.J.et/al. Biosensors and Bioelectronics, 2014, 51, 286–292.

  14. Table 2.1. Recent reported studies of MIP-based QCM sensor in different applications.

  15. 3. Results and Discussion • Electrochemical formation of NIP-Ppy was performed in PBS solution with 50 mM of pyrrole and MIP (UA)-Ppy in PBS solution with 50 mM of pyrrole and 5 mM of UA. • The EQCM-cell was filled with polymerization solutions and a single potential pulse of 1.0 V vs Ag/AgCl for 10 s was applied. • Resonant frequency of EQCM-resonator modified with MIP (UA)-Ppy has decreased by 37.72 Hz (increase of mass by 12.98 μg). • The resonant frequency of EQCM-resonator modified with the NIP-Ppy decreased by total of 13.77 Hz (the increase of mass by 4.74 μg).

  16. Fig 3.1. Electrochemical formation of NIP-Ppy and MIP (UA)-Ppy on EQCM-resonator. • The change of current • The change of charge during electrochemical deposition of MIP(UA)-Ppy and NIP-Ppy • The f of EQCM-resonator recorded during electrochemical deposition of MIP(UA)-Ppy

  17. In chronoamperometric curve: During the formation of MIP (UA)-Ppy the charge of 7.39 mC passed through the working electrode of EQCM-resonator & in the formation of NIP-Ppy 2.64 mC passed at the same conditions. • The mass of Ppy calculated according to the charge changes is lower than that calculated according to resonance frequency changes.

  18. Active sites of MIP-Ppy after affinity interaction are filled with caffeine molecules and formal mass of MIP-Ppy film is increasing. • After the washing of caffeine/theophylline from corresponding MIP-Ppy layers the resonance frequency of QCM sensor is recovering back to an initial level. Ratautaite, V.et/al. Sensors and Actuators B: Chemical, 2015, 212, 63–71.

  19. Fig. 3.2. ∆f of the gold coated QCM sensor modified with caffeine imprinted MIP-Ppy to the addition of different concentrations of caffeine and Theophylline dissolved in 50 mM PBS, pH 7.0.

  20. Fig 3.3. Calibration curves of theophylline and caffeine by QCM sensor modified with MIP-Ppy. • The QCM sensor modified by caffeine imprinted MIP-Ppy is more sensitive to caffeine than to the theophylline.

  21. The surfaces of MIP after removing the template and NIP were characterized using AFM • The morphologies of CBF-MIP after template removal display a large number of spherical structures and cavities whereas the NIP shows comparably smooth surface. • PFF-MIP after the template removal exhibits larger surface roughness compared to NIP. • The MIP after the template removal reveals cavities on the surface, which are not present in the NIP. Sroysee, W.et/al. Physics in Medicine, 2019, 100016.

  22. Fig 3.4. AFM image of CBF-MIP and PFF-MIP & corresponding NIP on glass slides.

  23. The dependence of resonance frequency of MIP (UA)-Ppy and NIP-Ppy modified EQCM-resonators of the UA concentration in the solution is shown at fig 3.5. • When the solution is exchanged from UA-free to UA containing, the resonance frequency of both MIP (UA)-Ppy and NIP-Ppy modified EQCM resonators increases. Plausinaitis, D.et/al.  Talanta, 2020, 121414.

  24. Fig 3.5. Changes of the resonance frequency of bare gold-electrode-based EQCM-resonator, EQCM-resonator modified by NIP-Ppy and EQCM-resonator modified by MIP (UA)-Ppy after the addition of different concentrations of UA dissolved in 50 mM PBS, pH 7.0.

  25. In the presence of template molecules, specific binding in the complementary cavities over whelm the non specific bindings. • MIP cavities are specific and selective for the analyte. • In NIP, functional groups are also present in polymer, they are randomly arranged in such a manner that it is ineffective for correct binding with template. • This leads to much greater affinity for the template molecule by molecular imprinting, in comparison with non imprinted one. Sadowska, M.et/al. Electrochimica Acta, 2021,368, 137599

  26. Fig. 3.6 Comparative study on the rebinding of Melphalan molecules by MIP & NIP at various concentrations of Melphalan.

  27. Fig 3.7. Calibration curves towards different UA concentrations registered on: Bare gold-electrode based EQCM-resonator, EQCM- resonator modified with NIP-Ppy & EQCM-resonator modified with MIP (UA)-Ppy.

  28. The selectivity of MIP (UA)-Ppy modified EQCM-resonator was tested by replacing UA with various concentrations of caffeine and glucose. • Results presented in fig. 3.8 reveals that the sensitivity towards glucose and caffeine is not significant.

  29. Fig. 3.8. Variations of resonant frequency of an EQCM-resonator modified by MIP (UA)-Ppy to the addition of different concentrations of: UA, caffeine & glucose.

  30. The interaction described by Langmuir isotherm, describes the adsorption of materials from homogeneous solution, can be applied at first. • For the reaction: Ppy sites+ A↔Ppy sites A……………..….1 • The equilibrium constantis expressedas: Ka = ………………….2

  31. Where: • ‘A’ is corresponding analyte. • [Ppy sites A] is concentration of binding sites bonded with ‘A’. • [Ppysites] is concentration of binding sites available for binding of ‘A’. • is a total number of molecularly imprinted MIP(UA)- Ppy sites, which are available for the analyte • is maximal possible surface-concentration of bounded analyte. • By rearrangement of equation (2):

  32. QCM-signal, based on Δf, is proportional to [PPysitesA] Δf = φ x [PPysitesA] • Then, equation (3) is modify to: • ‘φ’representsthesensitivityofEQCM- resonator (Hz/mM). • Equation (4) is appliedforthecalculationofKaforthebindingofUA totheMIP(UA)-Ppy.

  33. The fitting was applied for the interaction of UA with MIP (UA)-Ppy and NIP-Ppy. • Selected interfering materials for UA sensor is glucose. • It is present in blood, saliva, urine and tears of human beings in the range of 3–16 mM. Danaei, G.et/al. M. The Lancet,2011, 378(9785), 31–40. • In order to assess the influence of non-specific interaction of MIP (UA)-Ppy with glucose is represented in fig.3.9.

  34. Fig 3.9. Responses of MIP (UA)-Ppy modified EQCM- resonator towards different concentrations of UA and glucose and NIP-Ppy modified EQCM-resonator towards different concentrations of UA. Corresponding adsorption isotherms are calculated using equation 3.4.

  35. Table 3.1: Association constants Ka calculated for the interaction of UA with MIP(UA)-Ppy, NIP-Ppy and glucose with MIP(UA)-Ppy.

  36. Using calculated (Ka) Gibbs free energies (ΔGa) were calculated for interactions of UA with MIP(UA)-Ppy, UA with NIP-Ppy and glucose with MIP(UA)-Ppy by equation: ΔGa = -RT lnKa ……………..(5) • R is a constant , T is the temperature in K, (298 K). Plausinaitis, D.et/al. Talanta, 2020, 121414.

  37. The Ka of UA with MIP (UA)-Ppy is approximately higher than that of UA with NIP-Ppy. • By using equation (5), ΔGa were calculated for: • UA with MIP(UA)-Ppy (ΔGa = -16.4 ± 2.05 kJ/mol), • UA with NIP-Ppy (ΔGa = -13.3 ± 8.56 kJ/mol) and • Glucose with MIP(UA)-Ppy (ΔGa = -4.89 ± 1.79 kJ/mol). • The formation of UA complex with MIP (UA)-Ppy is thermodynamically more favourable than the formation of complexes of UA with NIP-Ppy or glucose with MIP (UA)-Ppy. • It was also found that ΔG = -43.5 kJ/mol for theophylline/MIP–Ppy deposited on boron doped nano crystalline substrate formed on Si wafer. • Viter, R.et/al. Biosensors and Bioelectronics, 2018, 99, 237–243. • Baleviciute, I.et/al. Synthetic Metals, 2015, 209, 206–211.

  38. The value of ΔG = - 6.0 ± 0.2 kJ/mol was determined for the interaction between l-glutamate and l-glutamate imprinted Ppy, ΔG = -6.6 kJ/mol for theophylline and theophylline imprinted Ppy and ΔG = -10.81 kJ/mol for caffeine and caffeine imprinted Ppy. • All above mentioned ΔG values suggests that the interactions are occurring due to hydrogen bonding or electrostatic interactions. • Calculated maximal signal of EQCM-resonator modified by MIP (UA)-Ppy towards glucose is in the range of 160.5 Hz. • The maximum signal of EQCM-resonator modified by MIP (UA)-Ppy towards UA is in the range of 106.8 Hz. • The response of the EQCM-resonator modified by MIP (UA)-Ppy towards glucose would be only in the range of ~5 Hz.

  39. 4. Conclusions • QCM sensors based on MIPs used in various applications are promising for selective recognition. • QCM sensors with high specificity and sensitivity are commonly used as monitoring tools for target compounds in complex matrices where the selectivity is crucial. • MIP-coated QCM sensor platforms can also be potentially applied to process control and monitoring, assistance in the development of new products as well as to the assessment of synergistic effects of food, drug, artificial enzyme and inhibitors and other innovative products.

  40. Resonant frequency during the deposition of MIP (UA)-Ppy decreased more than that during the deposition of NIP-Ppy. • Caffeine-imprinted MIP-Ppy demonstrated much higher selectivity towards caffeine in comparison with the selectivity towards its homologue theophylline. • The selectivity of EQCM-resonator modified by MIP (UA)-Ppy towards UA is significantly higher than that towards other interfering materials having similar molecular dimensions. • MIP sensors based on QCM targeting carbofuran and profenofos suggested that the CBF-MIP and PFF-MIP provides acceptable selectivity for the determination of CBF & PFF. • Sensor QCM coated chitosan/α-pinene with heating treatment shows high sensitivity and high selectivity to α-pinene .

  41. THANK YOU FOR YOUR ATTENTION!

More Related